Fig. 1.
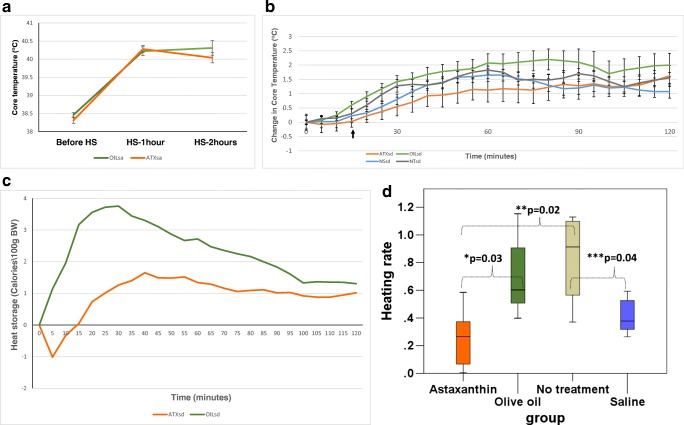
a Core temperature measured before, 1 h into heat stress (HS) HS, and at the end of the 2 h HS in the protein dynamics experiment. Average temperatures are displayed with standard error bars for the OILsa (n = 25) and ATXsa (n = 25) groups. b Changes in average core temperature of the ATXsd, OILsd, NSsd, and NTsd groups, recorded during the temperature dynamics experiment with standard error bars. N = 5 in each group. Rectal temperature measured after the onset of heat strain (indicated by the black arrow) was: 39.3 ± − 0.6, 38.4 ± 0.4, 38.9 ± 0.6, and 38.9 ± 0.6 oC for the ATXsd, OILsd, NSsd, and NTsd groups, respectively (1W ANOVA ns). c Average heat strain experienced during HS by the ATX (red line) and OIL (green line) groups. Cumulative heat strain in the ATX group from 15 to 120 min (no heat storage was apparent before this point) was significantly different from that of the OIL group between 0 and 120 min (where heat storage began earlier) (t test, one tailed, equal variance, p = 0.025). d Average heating rate per minute (Calories × 100 g BW−1 × min−1) experienced by the four groups, until the peak heating rate was achieved. The heating rate for ATXsd was significantly lower than that of OILsd (*p = 0.03) and NTsd (**p = 0.02). The heating rate for NT was significantly higher than that of NSsd (***p = 0.04)

