Fig. 2.
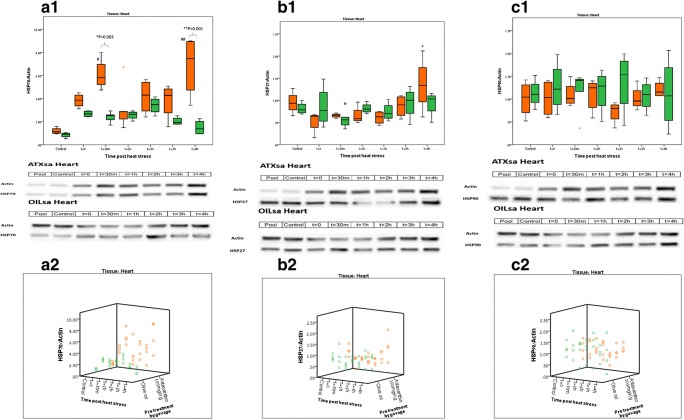
Heat shock protein dynamics post heat stress in the heart. Orange boxes—ATXsa group; Green boxes—OILsa group. n = 4–5 animals per group for each time point. Blot representations of sample membranes appear below for ATXsa and OILsa. a.1 Cardiac HSP72 protein dynamics post HS. *ATXsa t = 30 m was significantly higher than OILsa t = 30 m (p = 0.003); **ATXsa t = 4 h was significantly higher than OILsa t = 4 h (p < 0.001); #ATXsa t = 30 m, and 4 h post HS were significantly higher than the control, (p < 0.001). a.2 Cardiac HSP72 protein dynamics post HS, individual animals represented in a 3D plot. b.1 Cardiac HSP27 protein dynamics post HS. *ATXsa t = 4 h was significantly higher than ATXsa t = 0, t = 1 h, and t = 2 h (p < 0.05). b.2 Cardiac HSP27 protein dynamics post HS, individual animals represented in a 3D plot. c.1 Cardiac HSP90 protein dynamics post HS. c.2 Cardiac HSP90 protein dynamics post HS, individual animals represented in a 3D plot

