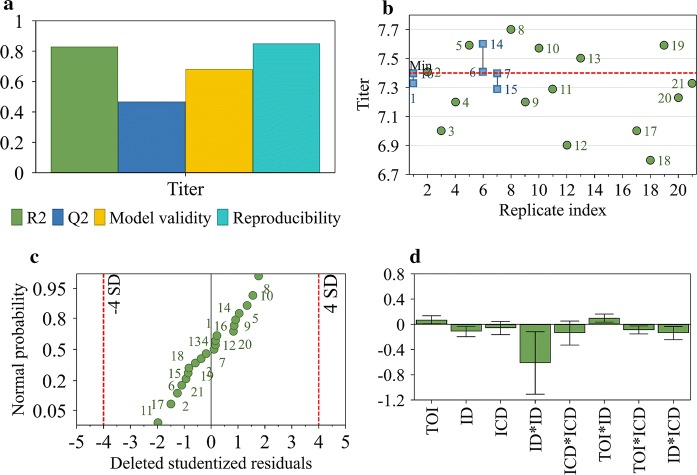
Fig. 3.
Model analysis of DoE in tube-fixed-bioreactor with MODDE software. a Summary of fit for PRV production. R2 = 0.83 (adjusted R2 = 0.72), Q2 = 0.47, validity = 0.68, reproducibility = 0.85. b Replicate plot for PRV production with experiment number labels. The replicated experiment in replicate plot shows in blue point connected by a line. c Residual plot for PRV production. The red dash lines indicated fourfold standard deviation. d The coefficient (scaled and centered) plot for PRV production

