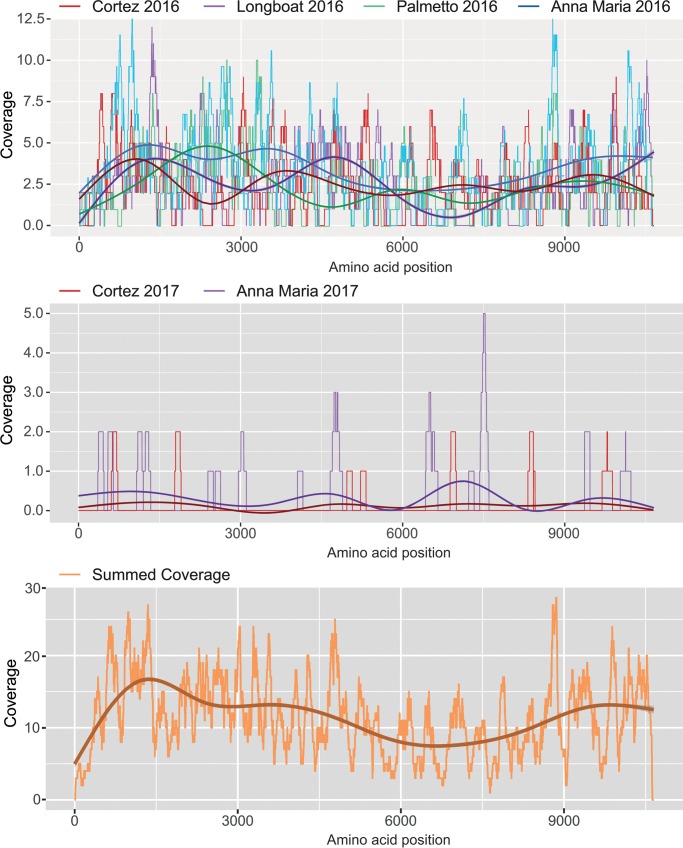
FIG 2.
Mapping of RNASeq reads on the DENV4 genome. Coverage plots for DENV4 genome readings are shown from top to bottom in the graph panels. Coverage values across the genome for collection site/year combinations are shown as indicated. Coverage is depicted on each y axis and amino acid position on the x axes. The smoothed central lines on the graphs indicate median values.

