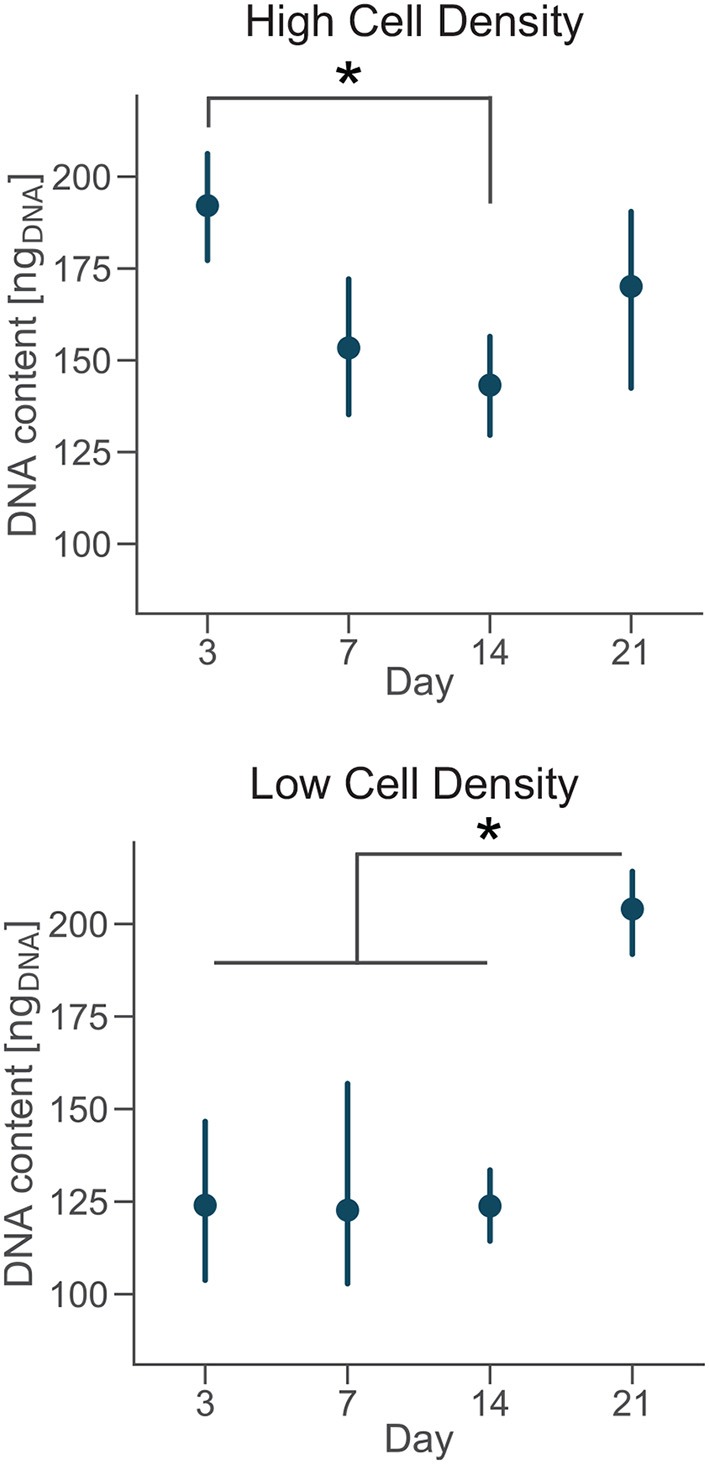
Figure 4.

Cells cultured at low density proliferate over time. DNA content of each group at day 3, 7, 14, and 21. Point plots denote the mean of n = 6 samples with error bars representing 95% of confidence interval. *Represents statistical significance (p < 0.05) between indicated groups using one-way ANOVA with Tukey's post-hoc test.
