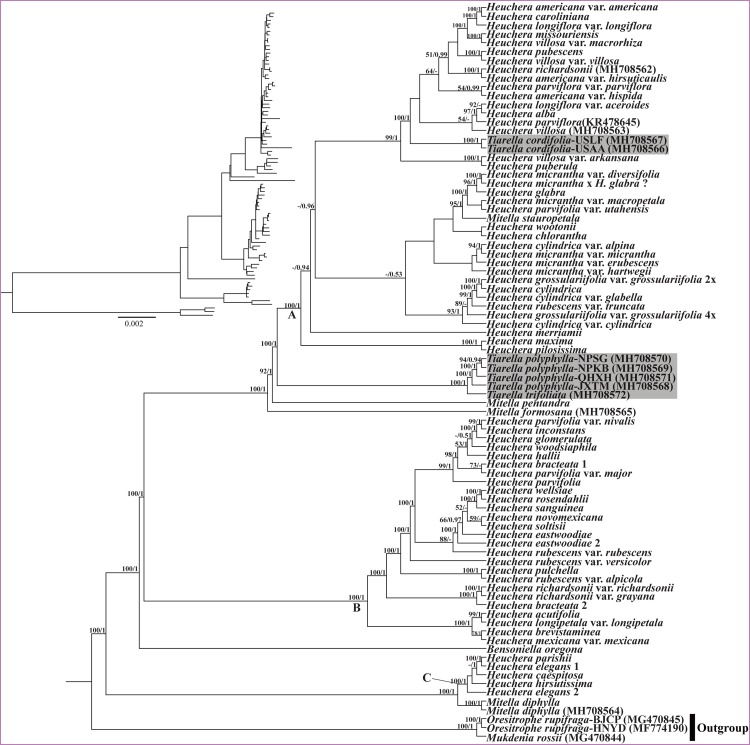
FIGURE 7.
Phylogenetic tree reconstruction using maximum likelihood (ML) based on whole plastome sequences. The inset topology in the upper left shows the relative branch lengths in per-site substitutions. Numbers above the branches represent ML bootstrap/Bayesian posterior probability (BS/PP). Hyphen indicate a bootstrap value or posterior probability <50%. Clade labels follow those for chloroplast clades recovered in Folk et al. (2017). Gray highlighted labels indicate the position of Tiarella plastomes.

