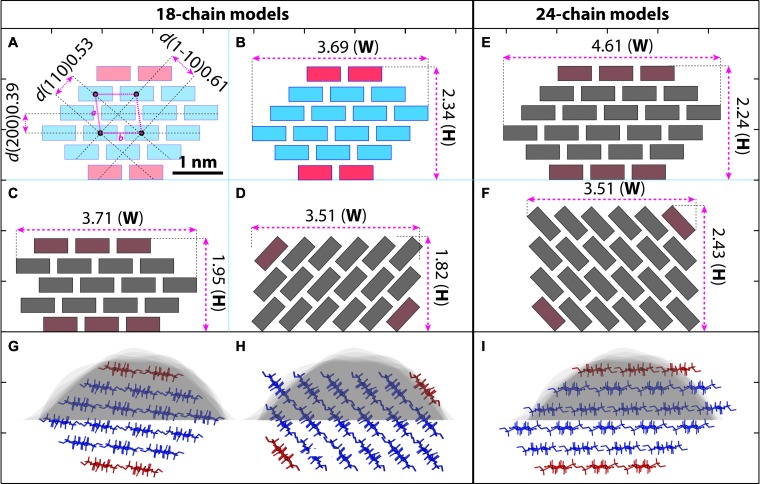
FIGURE 7.
Hypothetical models of cellulose microfibril and empirical fitting to measured data. (A–F) Cross-section shapes and calculated height (H) and width (W) with 18-chain and 24-chain. Cellulose chains are presented as simplified boxes. (A) The 18-chain model is built based on the cellulose Iβ structure (Nishiyama et al., 2002). The two chains in the hydrophobic surface are shown in red. (B–D) Calculated size of the 18-chains 234432 model (B), 34443 model (C), and 12333321 model (D). (E,F) 24-chain models in 345543 (E) and 123444321 (F) conformations. (G–I) The 234432 model (B) fits the best to our AFM measurement (gray background, see also Figure 6E) compared with 12333321 (D) and 345543 (E) models. Scale bar = 1 nm.

