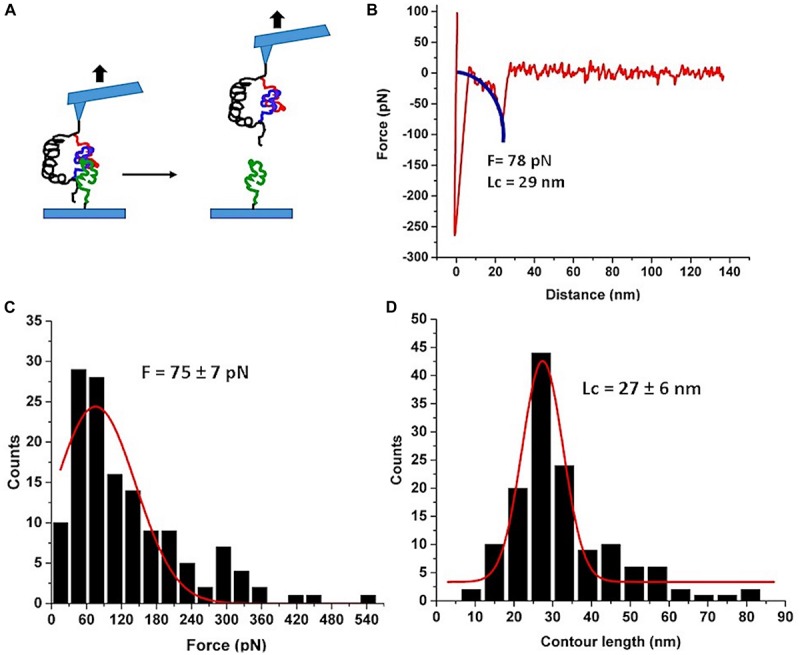
FIGURE 4.

AFM force spectroscopy probing of Aβ42 trimer. (A) The schematic for the experimental set up. Three Aβ42 monomers are shown in different colors for clarity. (B) A typical force curve of the force spectroscopy experiment. The blue curve is WLC fitting. (C) The histogram of the rupture forces approximated with a Gaussian (red curve) with the maximum at 75 ± 7 pN. (D) The histogram of contour lengths with the Gaussian fitting. The peak value is 27 ± 6 nm. Number of rupture events used in (B and C) is 137.
