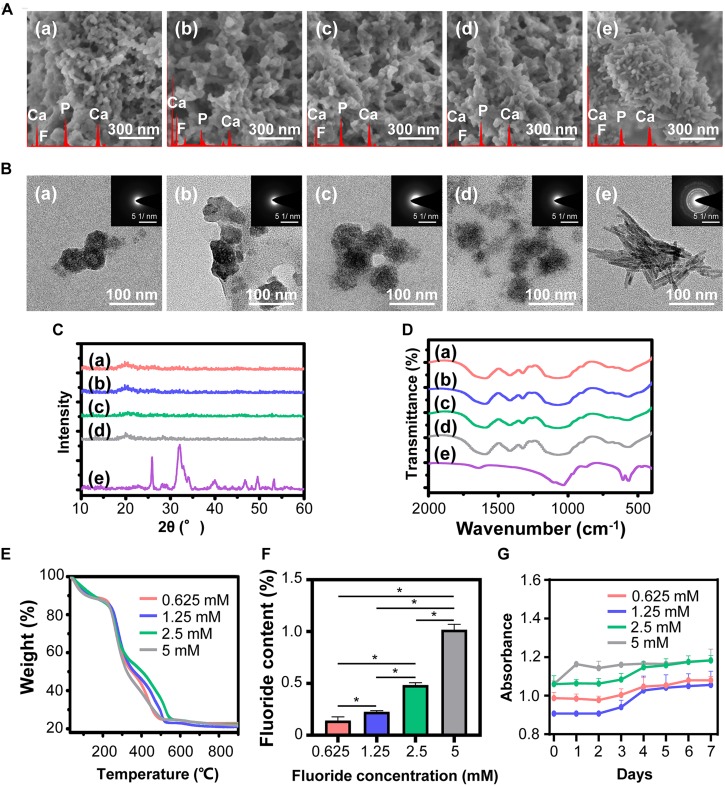
FIGURE 2.
Synthesis and characterization of FACP with different fluorine concentration. (A) SEM images, (B) TEM images and the corresponding SAED pattern, (C) XRD spectra, and (D) FITR spectra of FACP with different fluorine concentration. In A–D, the initial fluorine concentration of FACP was (a) 0.625, (b) 1.25, (c) 2.5, and (d) 5 mM. (e) Synthesized fluorine containing calcium phosphate without CMCS. (E) TGA result and (F) fluorine content of FACP. (G) OD profiles (650 nm) of FACP dispersion up to 7 days. Asterisk on top of each bar indicated statistically difference between groups (p < 0.05).

