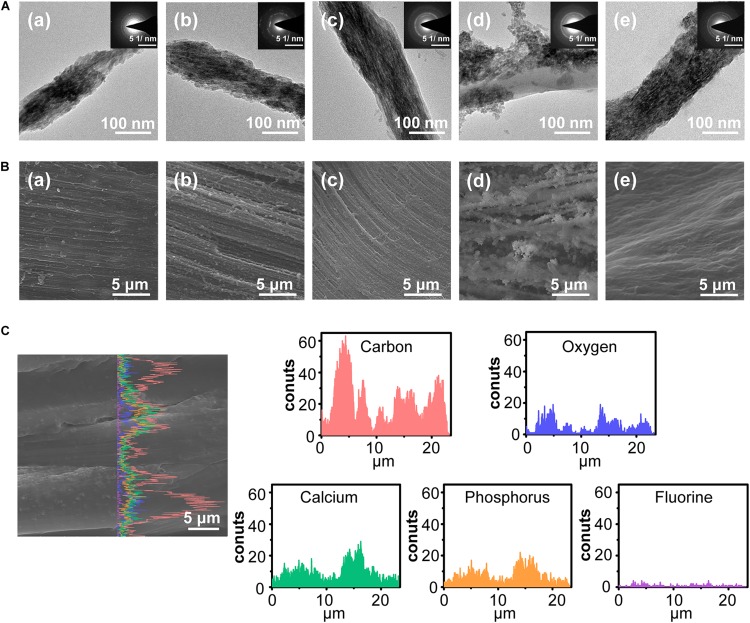
FIGURE 4.
The morphology of biomimetic cementum. (A) TEM images and the corresponding SAED pattern of biomimetic cementum. (B) The surface view of SEM image. (a–d) indicated 0.625, 1.25, 2.5, and 5 mM group of biomimetic cementum, respectively. (e) Cementum. (C) The SEM images with corresponding EDS line scanning along the longitudinal section of 2.5 mM biomimetic cementum.

