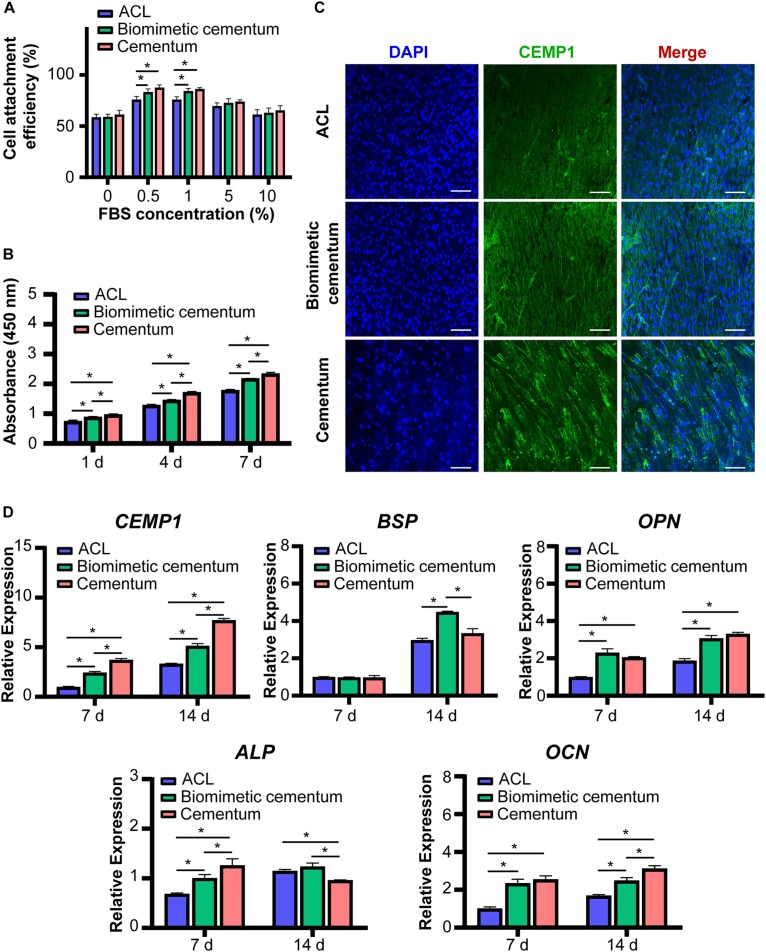
FIGURE 6.
The in vitro effect of biomimetic cementum on the PDLCs. (A) Cells adhesion under various concentrations of FBS. (B) Proliferation. (C) The immunofluorescent image of CEMP1 protein expressed in PDLCs after 14 days. Blue fluorescence represents nuclei and green fluorescence represents CEMP1. Scale bar: 100 μm. (D) Gene expression results of CEMP1, ALP, BSP, OPN, and OCN. Asterisk on top of each bar indicated statistically difference between groups (p < 0.05).

