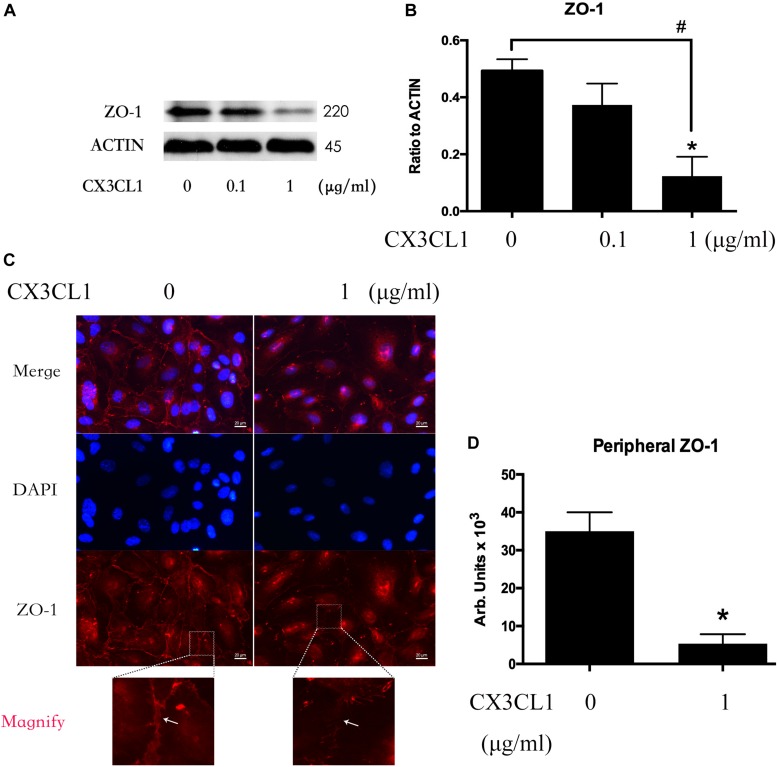
FIGURE 4.
CX3CL1 induces ZO-1 disruption in VMECs. (A) The expression of ZO-1 was examined at the indicated time point after CX3CL1 (1 μg/ml) stimulation in VMECs. (B) The results were represented as a histogram according to band intensities. (C) Immunofluorescence analysis of ZO-1 in the VMECs. (D) The results were represented as a histogram according to measurement of the integrated fluorescence density in the peripheral area. *P < 0.05 vs. the negative control.

