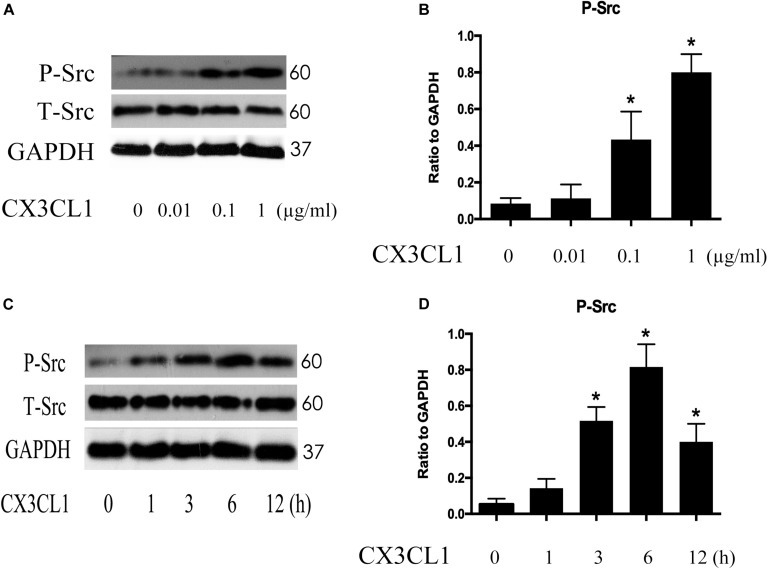
FIGURE 5.
CX3CL1 induces Src activation in VMECs. (A) P-Src was detected after stimulation with different concentrations of CX3CL1 (0, 0.01, 0.1, 1 μg/ml) for 6 h, and the peak appeared at a concentration of 1 μg/ml. (B) The results were represented as a histogram according to band intensities. (C) VMECs were stimulated with CX3CL1 (1 μg/ml) at the different indicated times, and the peak appeared at 6 h. (D) The results were represented as a histogram according to band intensities. *P < 0.05 vs. the negative control.

