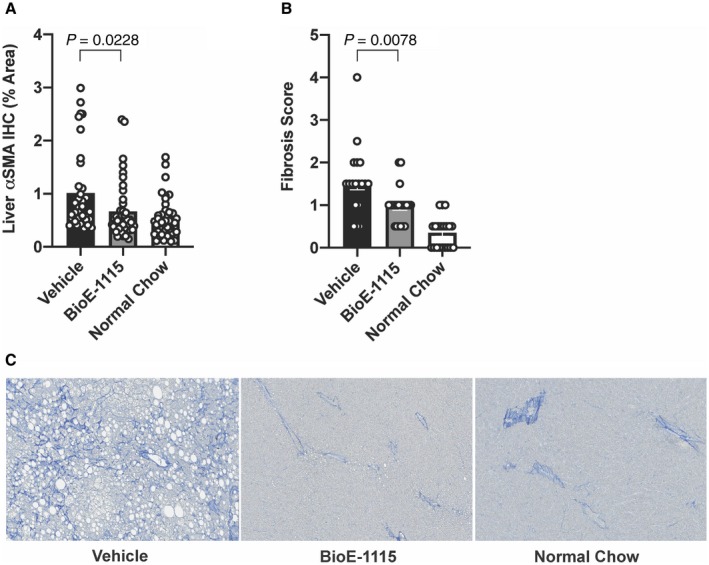
Fig. 5.

Liver collagen and αSMA among treatment groups. (A) Immunolabeled αSMA as a percentage of total tissue area quantified by image analysis. (B) Fibrosis score assessed as histopathologic quantification of collagen based on MT‐stained slides. Results are depicted as mean ± SEM. (C) Representative MT stains from individual mice fed an HF‐HFrD and treated with vehicle or BioE‐1115, or mice fed an NCD. Magnification ×10. Abbreviation: IHC, immunohistochemistry.
