
Fig. 2.
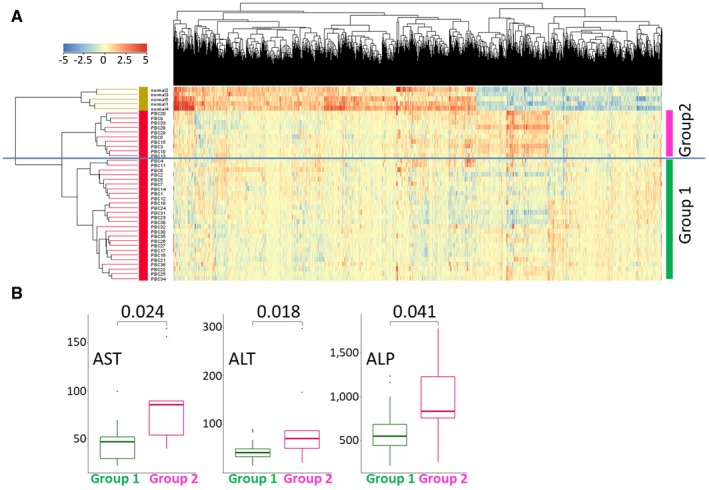
(A) Hierarchical clustering of 1,574 significant genes from the microarray analysis in 36 patients with PBC and 5 controls. The samples were divided into three groups: PBC group 1, PBC group 2, and normal. (B) Distribution of serum markers of PBC activity (AST, ALT, and ALP) in patients with PBC. Mean AST, ALT, and ALP values were all significantly higher in PBC group 2 than in PBC group 1. P values based on the Wilcoxon test are shown.