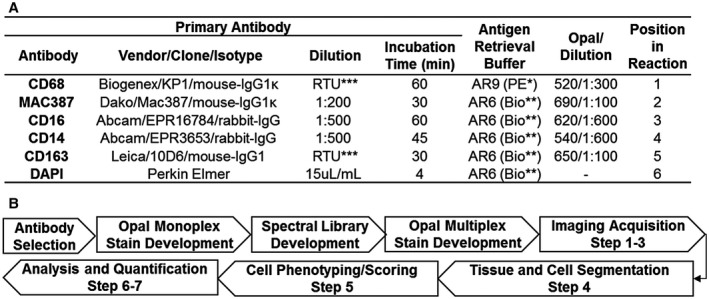
Figure 1.

(A) Antibodies, optimized multiplex conditions, and steps used to identify intrahepatic macrophages in human FFPE liver biopsies. To optimize antibody concentrations, we first evaluated different dilutions of primary antibodies using the simulated bright field view in the inForm software program and chose the dilution with the best staining pattern (determined by a subspecialty‐trained, board‐certified pathologist). We then evaluated different dilutions of the Opal fluorophores until signal intensities were in the optimal range and well balanced between each of the monoplex slides. Once these steps were optimized, we then combined the antibodies together in the multiplex assay. *Akoya Biosciences, **Biogenex, ***Ready to Use (RTU). (B) Workflow for assay development and imaging analysis. The flow diagram highlights the optimization steps as well as the seven steps used for imaging acquisition and analysis. Step 1: Whole slides containing liver biopsy tissue were scanned with the Vectra 3 at low magnification (10×). Step 2: Vectra 3 was coupled with the Phenochart application, which allows whole‐slide navigation, annotation, and identification/selection of areas of interest for high‐resolution acquisition. For comparison of the initial single images, we selected representative 20× images that contained both portal tracts and lobules from either controls or patients with different types of liver disease (i.e., HCV, NASH, and AIH). For the experiments with multiple patients per group, the software randomly selected ROIs from 50% of the total surface area of each liver biopsy and captured these images using the 20× lens. Step 3: Images obtained were imported into inForm software to create a training project, which allows unmixing of signals and removal of tissue autofluorescence (using the previously optimized Spectral Library, Fig. 2). Step 4: Using inForm, we then optimized liver‐tissue segmentation (using both manual and trainable methods) into portal tracts and lobules, performed cell segmentation, and confirmed antibody staining within the proper compartment (i.e., nucleus, cytoplasm, and/or membrane). Step 5: Macrophages were phenotyped based on the labeling of CD68, CD163, MAC387, CD14, and CD16. The likelihood of co‐localization of different fluorophores was compensated during the phenotyping step using Visiopharm analysis, which uses two important parameters: signal intensity and percent coverage. Scoring of the macrophage markers was also possible after selecting the optimized marker threshold using inForm software, processing only two markers at a time. Step 6: Optimized settings and conditions were saved as an algorithm that was then used to analyze all of the images in “batch” (i.e., all images from all patients analyzed with the same setting conditions). Step 7: Data of individual cells were identified using the cell segmentation data feature of inForm.
