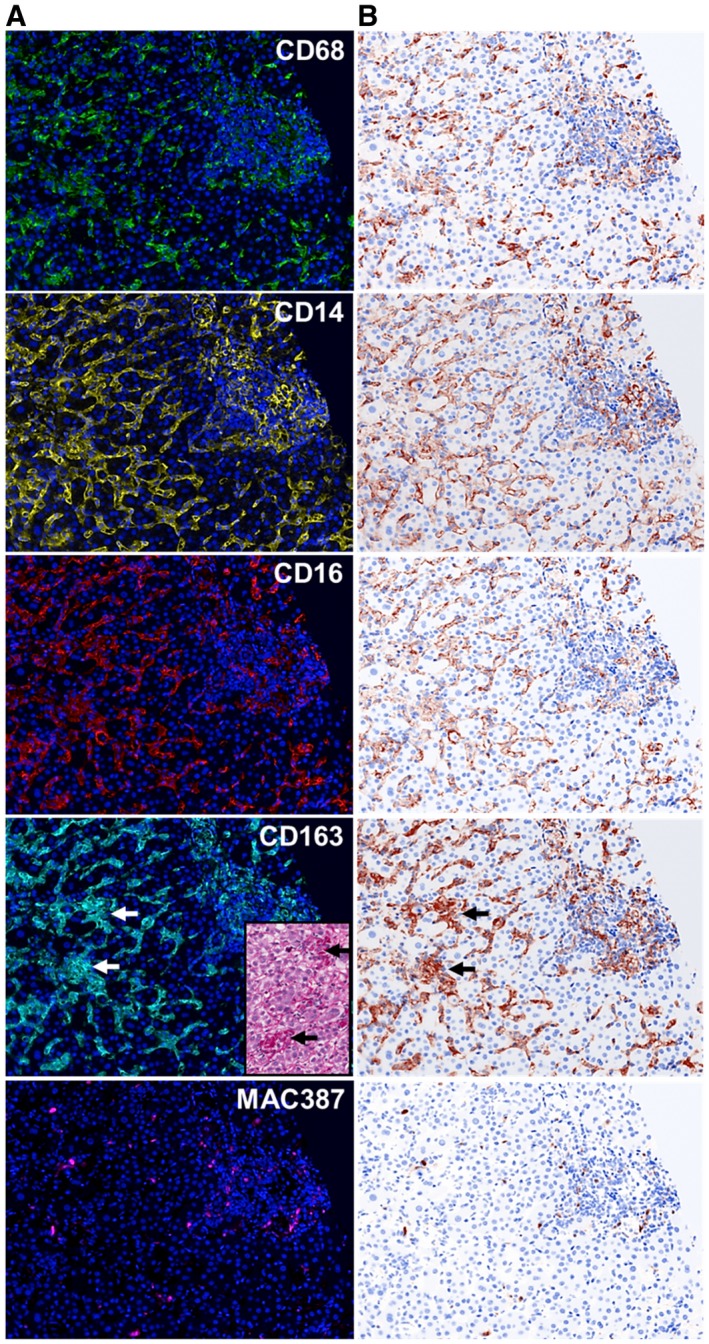
Figure 3.

Visualization of each fluorophore channel acquired from multiplex‐staining a liver biopsy from a patient with AIH. (A) We stained a representative unstained liver biopsy slide from a patient with AIH with the multiplex panel. A single 20× fluorescence image that included both portal tract and lobular regions was obtained after spectral unmixing was applied. These steps allowed the expression of each individual macrophage marker to be visualized in the context of hepatic architecture: CD68 (green‐Opal 520), CD14 (yellow‐Opal 540), CD16 (red‐ Opal 620), CD163 (cyan‐Opal 650), MAC387 (magenta‐Opal 690), and nuclear stain (Blue‐DAPI). (B) Simulated brightfield images were generated to recreate the staining pattern that would be observed by conventional IHC using chromogenic methods. Large aggregates of macrophages were observed in the lobules, and these showed high expression of CD163; these cells correlated with the large aggregates of macrophages that were observed by light microscopy (inset; PASD stain). The patient with AIH had active chronic hepatitis with a modified hepatitis activity index of 13/18 and a fibrosis stage of 2/6.(30) For comparison, images from a representative control patient are shown in Supporting Fig. S1.
