Figure 4.

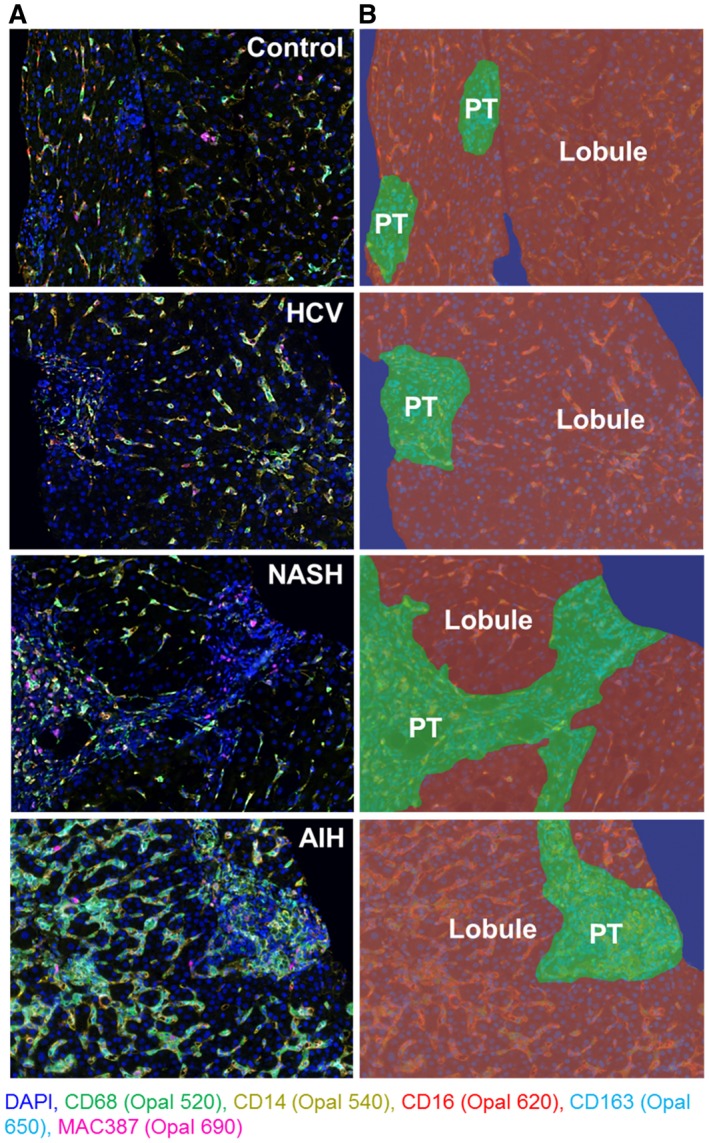
Spectral imaging analysis of patients with different chronic liver diseases (HCV, NASH, and AIH) highlights intrahepatic macrophages. We tested the optimized multiplex panel on unstained slides obtained from liver biopsies collected from representative patients with different types of chronic liver disease (n = 1 of each disease type) that had similar fibrosis stages and compared them with a control patient who did not have liver disease (i.e., no histopathologic changes and normal liver enzymes at the time of biopsy) (n = 1). (A) Representative unmixed multispectral images obtained after staining unstained slides with the macrophage multiplex panel. From each biopsy, we chose single images that contained both portal tracts and lobules. Images were acquired at 20× using inForm software. (B) Representative images after using the tissue‐segmentation feature of inForm on the multiplex images from (A). The 20× images were divided into portal tract (green), lobular (brown), and nontissue (blue) areas. HCV: MHAI, 4/18; fibrosis stage, 3/6. AIH: MHAI, 13/18; fibrosis stage, 2/6. NASH: nonalcoholic fatty liver disease activity score (NAS), 4/8; fibrosis stage, 2/4. Abbreviation: PT, portal tract.
