Figure 5.

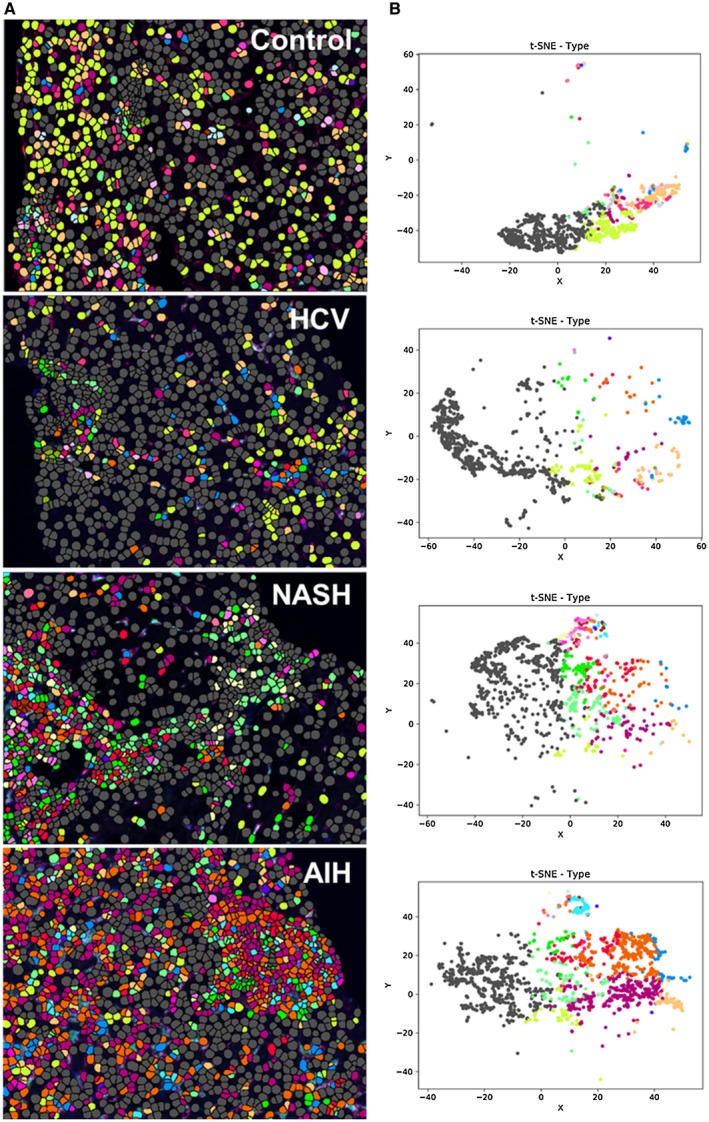
Spectral images analyzed with Visiopharm applications highlight cellular expansion and increased complexity in diseased livers when compared with controls. (A) Single multiplex images from Fig. 4A were used to export multicomponent TIFF files for Visiopharm analysis. A phenotyping application was used to determine the number of different cellular phenotypes present in each image after staining with the 6‐color (including DAPI) multiplex panel. Each colored dot represents a unique cellular phenotype. Gray dots represent cells that were negative for all of the markers in the multiplex panel (i.e., CD68, CD14, CD16, CD163, and MAC387). (B) t‐SNE plots highlight the unique patterns of concatenated cellular markers that are present in the representative liver images from patients with chronic liver diseases when compared with a control patient. This algorithm uses nonlinear dimensional reduction to allow visualization of high dimensional data sets. Cells with similar properties appear closer together and those that are dissimilar appear farther apart in the 2‐dimensional map. The control patient showed much less diversity in the types of macrophages and other cellular phenotypes identified when compared to patients with chronic liver disease. AIH: MHAI, 13/18; fibrosis stage, 2/6. HCV: MHAI, 4/18; fibrosis stage, 3/6. NASH: NAS, 4/8; fibrosis stage, 2/4.
