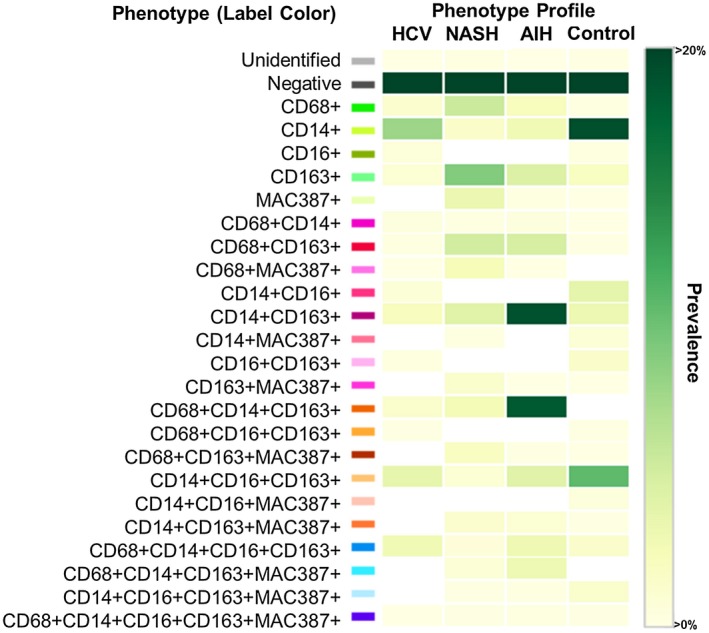
Figure 6.

Phenotypic matrix algorithms were used to identify macrophage and other cellular phenotypes present in liver biopsies obtained from patients with chronic liver disease when compared with a control. Using the same exported multicomponent TIFF files from Fig. 5, we used Visiopharm phenotype matrix algorithms to determine the different cellular phenotypes present in each of the 20× multiplex images. The colors shown for each of the different phenotypes correlate with the various colored dots (i.e., individual cells) shown in the multiplex images from Fig. 5. Dark green and white boxes indicate the populations with the highest and lowest prevalence, respectively. Approximately 20 different macrophage populations (i.e., those that are positive for CD68, CD163, or MAC387) were identified using the five markers in the multiplex staining assay. The patient with AIH showed two prominent populations (CD14+CD163+ and CD68+CD14+CD163+), and the control patient had the highest prevalence of CD14+ expression alone (in the absence of other markers). AIH: MHAI, 13/18; fibrosis stage, 2/6. HCV: MHAI, 4/18; fibrosis stage, 3/6. NASH: NAS, 4/8; fibrosis stage, 2/4.
