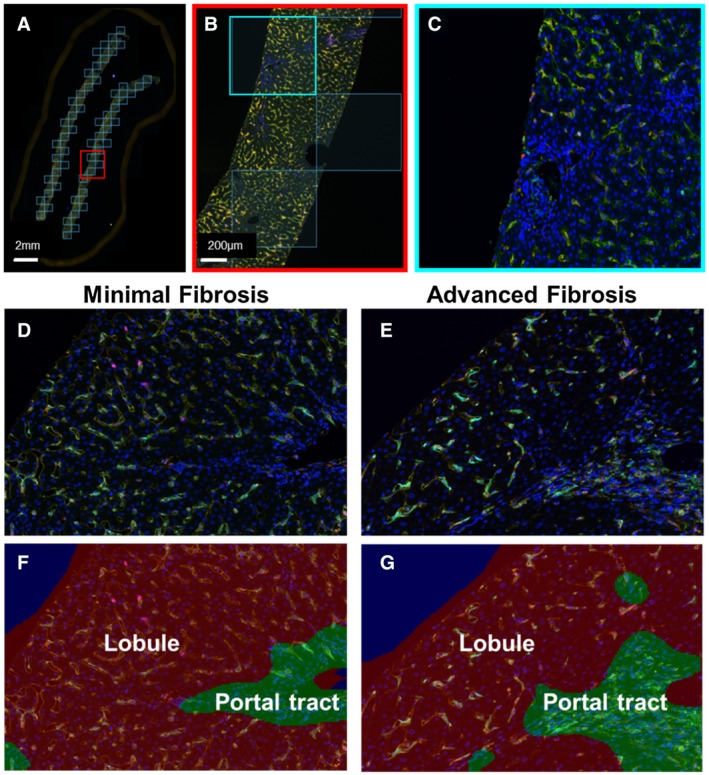
Figure 7.

Example of batch analysis and collection of ROIs in each patient’s liver biopsy. We tested the feasibility of the platform for collecting multiple images per liver biopsy and added more patients per group. We used the multiplex panel to stain biopsies from control patients (n = 8) and patients with chronic hepatitis C and either minimal (n = 5) or advanced fibrosis (n = 6). Clinical information pertaining to these patients is provided in Supporting Table S1, and representative examples of liver biopsies collected from patients with minimal or advanced fibrosis are shown in Supporting Fig. S3 and S4. (A) The Phenochart application of inForm software was used to randomly stamp multiple ROIs in each liver biopsy (totaling at least 50% of the tissue). These corresponded to 50‐70 images per patient, depending on the size of the liver biopsy. (B,C) Each of the ROIs were then acquired at 20×. (D,E) Representative multiplex images from patients who were HCV‐positive with minimal or advanced fibrosis. (F,G) Examples of the tissue segmentation feature of the software that allowed separation of the parenchyma into portal tracts and lobules. MHAI scores and fibrosis stages for all patients in Figs. 7 and 8 are provided in Supporting Table S1.
