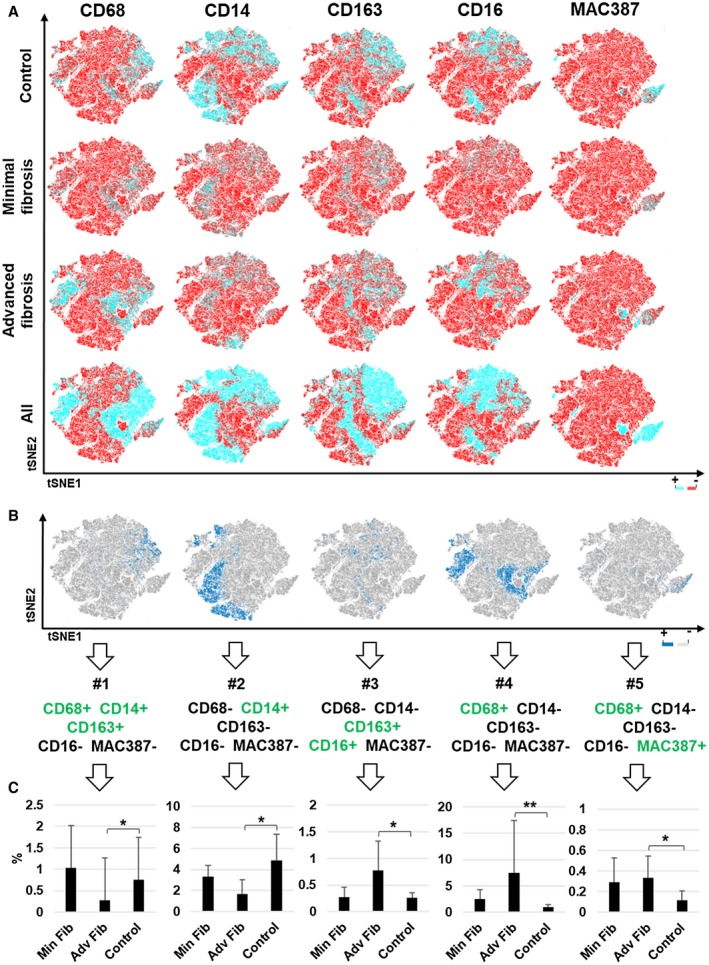
Figure 8.

t‐SNE analysis highlighted significantly different cellular populations between patients with advanced fibrosis due to chronic hepatitis C when compared with controls. We analyzed the multiple images collected from the same patients shown in Fig. 7 (controls, n = 8; minimal fibrosis, n = 5; and advanced fibrosis, n = 6) using expression heat maps from t‐SNE and phenotype cluster analyses. (A) Heat maps showing differences in expression of each individual macrophage marker (CD68, CD14, CD163, CD16, and MAC387) within the control, minimal fibrosis, and advanced fibrosis groups. (B,C) Five clusters that were significantly increased between control and patients who were HCV‐positive with advanced fibrosis were overlaid individually on the concatenated t‐SNE plot from Fig. 8A. Clusters of cells expressing the different markers, positive (blue) or negative (gray), are shown. These five subpopulations showed significant differences between the control and advanced fibrosis groups. All data are presented as median with significance calculated using the Wilcoxon rank sum test (*P < 0.05; ***P < 0.01).
