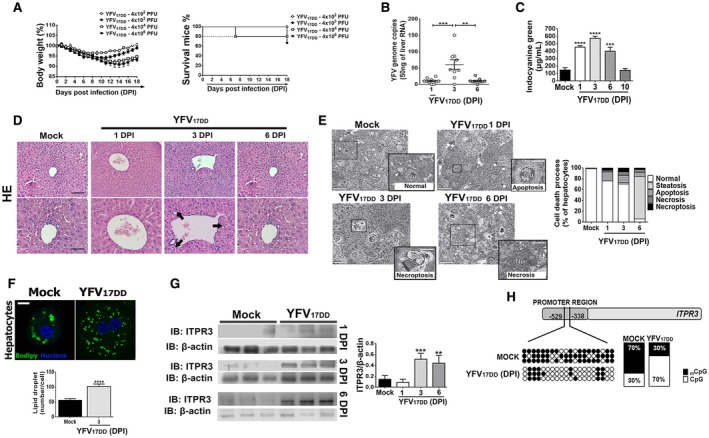
Fig. 2.

Mouse model replicates histological findings in patients with liver failure from YF infection. IFN‐α/βR−/− SV129 mice (7–9 weeks old) were inoculated intravenously with YFV strain (YFVV17DD) vaccine. (A) Changes in body weight (left panel) and Kaplan‐Meier survival curve (right panel) after inoculums of 4 × 10² to 4 × 10⁶ PFU. (B) Quantitative RT‐PCR analysis of YFV viral load in the mice livers on 1 dpi, 3 dpi, and 6 dpi after inoculation of 4 × 10⁴ PFU. Results are expressed as mean ± SEM (**P < 0.01 and ***P < 0.001 using ANOVA, Bonferroni’s posttest). (C) Liver function measured by the ICG clearance after inoculation of 4 × 10⁴ PFU. Bars indicate mean ± SEM of samples from 3‐6 animals/group (***P < 0.001 and ****P < 0.0001 using ANOVA, Bonferroni’s posttest compared with mock samples). (D) Representative H&E‐stained liver slices of mock and YFV17DD inoculated animals on 1 dpi, 3 dpi, and 6 dpi. Scale bar: 50 μm and 100 μm. Arrows indicate hydropic degeneration characterized by the presence of swollen hepatocytes with clear and vacuolated cytoplasm and central nucleus. (E) Images of high‐resolution light microscopy of 300‐μm‐thick liver sections stained with toluidine blue, and representative images of mock and YFV17DD inoculated mice on 1 dpi (B), 3 dpi (C), and 6 dpi (D) showing hepatocytes with normal aspect (white *) and ongoing different cell death processes (black *). Normal hepatocytes from mock animal with central nucleus, rough cytoplasm with many organelles, and few lipid droplets (arrowheads). Early apoptosis with initial cell and organelle condensation in hepatocyte from 1 dpi of YFV17DD. Necroptosis characterized by pale and swollen nucleus and cytoplasm with plasma membrane integrity in hepatocyte from 3 dpi of YFV17DD. Necrosis, illustrated by empty spaces of cytoplasm in hepatocyte from 6 dpi of YFV17DD (left panel). Arrows indicate sinusoid capillaries; arrowheads indicate lipid droplets (scale bar: 25 μm and 50 μm). Frequency of cell death processes and steatosis analyzed in high‐resolution images of 300‐nm‐thick sections (right panel). (F) Representative immunofluorescence images of isolated hepatocytes stained with Bodipy (green) and 4′,6‐diamidino‐2‐phenylindol (blue) from mock and YFV17DD 3‐dpi inoculated animals (upper panel) (scale bar: 20 μm). Bottom panel shows the quantification of lipid droplets (number/cell). Bars indicate mean ± SEM of samples from three animals/group (****P < 0.0001 using Student t test). (G) ITPR3 expression is increased in liver 3 and 6 days after infection of mice with YFV17DD. Left panel shows representative blots for ITPR3 expression in liver lysates from mock, and YFV17DD 1‐dpi, 3‐dpi, and 6‐dpi inoculated animals. Each lane reflects the blot for the lysate from a separate animal. Right panel shows quantification of ITPR3 expression, normalized by b‐actin. Bars indicate mean ± SEM of samples from 3‐6 animals/group (**P < 0.01 and ***P < 0.001 using ANOVA, Bonferroni’s posttest compared with mock samples). (H) Demethylation sites on cytosine‐guanine dinucleotide (CpG) islands in mouse ITPR3 promoter region after 3 dpi with YFV17DD virus. Black dots represent methylated sites, and white dots represent demethylated sites. Quantification of methylated/demethylated CpG island ratio in mock and YFV‐infected liver samples. Abbreviations: IB, immunoblot; Nu, nucleus.
