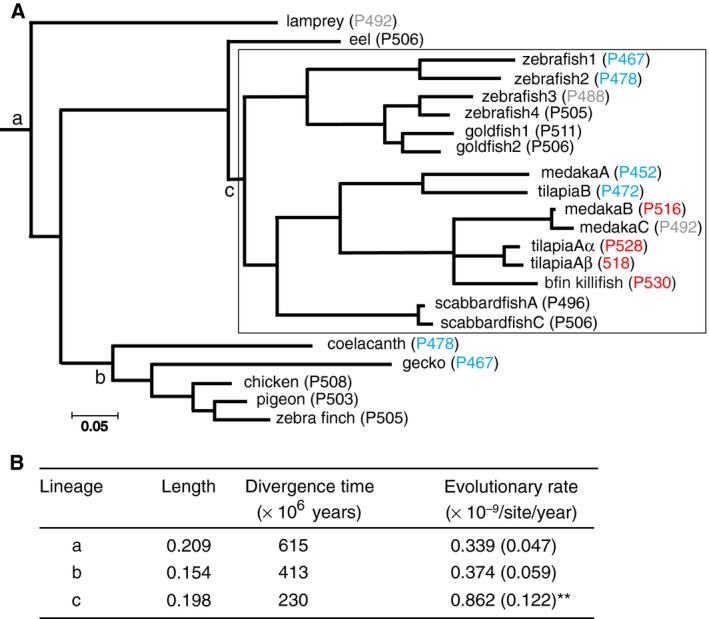
Fig. 2.

(A) The numbers of amino acid substitutions per site for a composite tree of 22 RH2 pigments were determined by applying PAML [33] to the amino acids between sites 31 and 311. Blue, grey, black and red indicate the λmaxs of 452–478, 488–492, 495–511 nm and 516–530 nm, respectively. (B) The evolutionary rates of amino acid substitution along the branches including gene duplications (c lineage) and without gene duplications (a and b lineages). **P < 0.01 for the comparison of the branches between c‐present and a‐present and between those between c‐present and b‐present. The numbers in the parentheses indicate SE.
