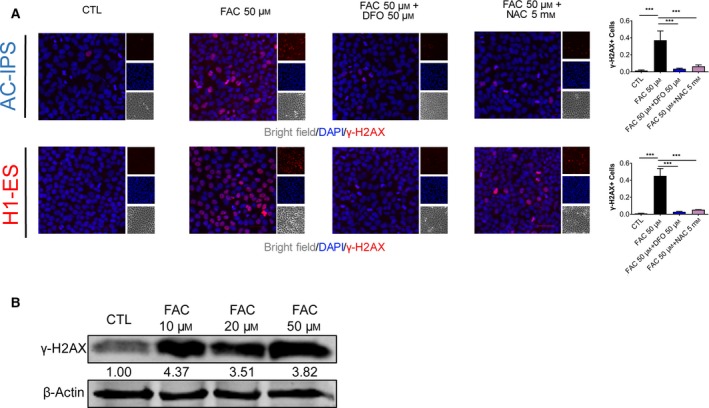
Fig. 4.

(A) Immunofluorescence analysis of DNA damage in AC‐iPSCs and H1‐ESCs treated with 50 μm FAC, 50 μm FAC + 50 μm DFO and 50 μm FAC + 5 mm NAC. Scale bars, 50 μm. Data are shown as mean ± SEM (n = 4). One‐way ANOVA was applied. ***P < 0.001. (B) Western blot analysis of γ‐H2A.X expression in H1‐ESCs treated with different concentrations of FAC for 16 h.
