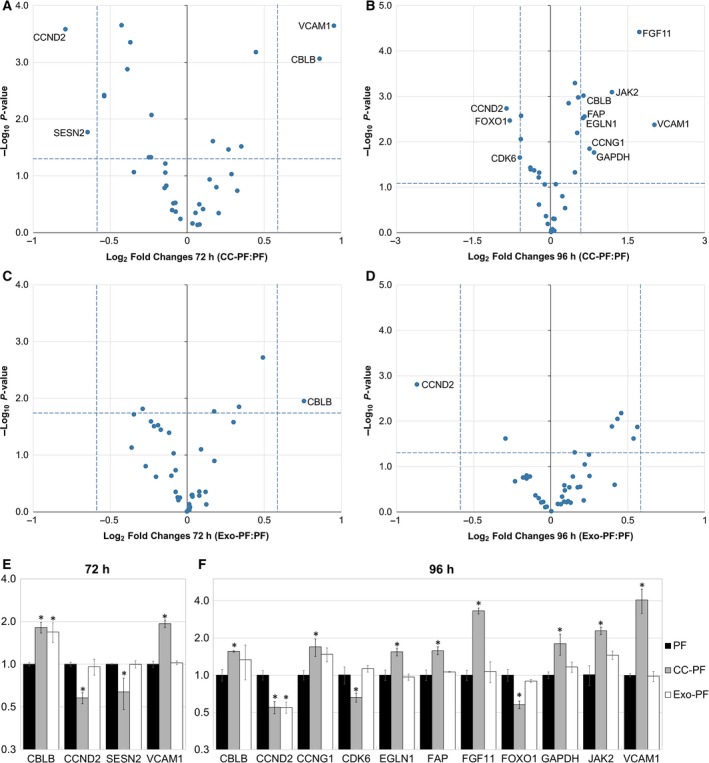
Fig. 3.

Relative expression of predicted mRNA targets in canine PFs compared with PF control group. (A) 72 h and (B) 96 h after coculture with C2 cells: CC‐PF group. (C) 72 h and (D) 96 h after culture with C2‐derived exosomes: Exo‐PF group. Regulated mRNAs in each group and time point (A–D) are indicated with their names in the plot. Bar charts show only regulated mRNA targets after (E) 72 h and (F) 96 h in CC‐PF and Exo‐PF groups. Results were normalised to HPRT1 and RPS19 and analysed using the 2‐ΔΔCT method. Datasets are expressed as means of three biological samples and duplicate measurements ± SD, analysed with a two‐tailed Student’s t‐test and transformed into log2 vs. –log10 P‐value for volcano plots (A‐D). Asterisks represent a statistical significance compared with the control group FB (*P < 0.05)
