
Figure 3. Loss of Fancd2 leads to PGC depletion.
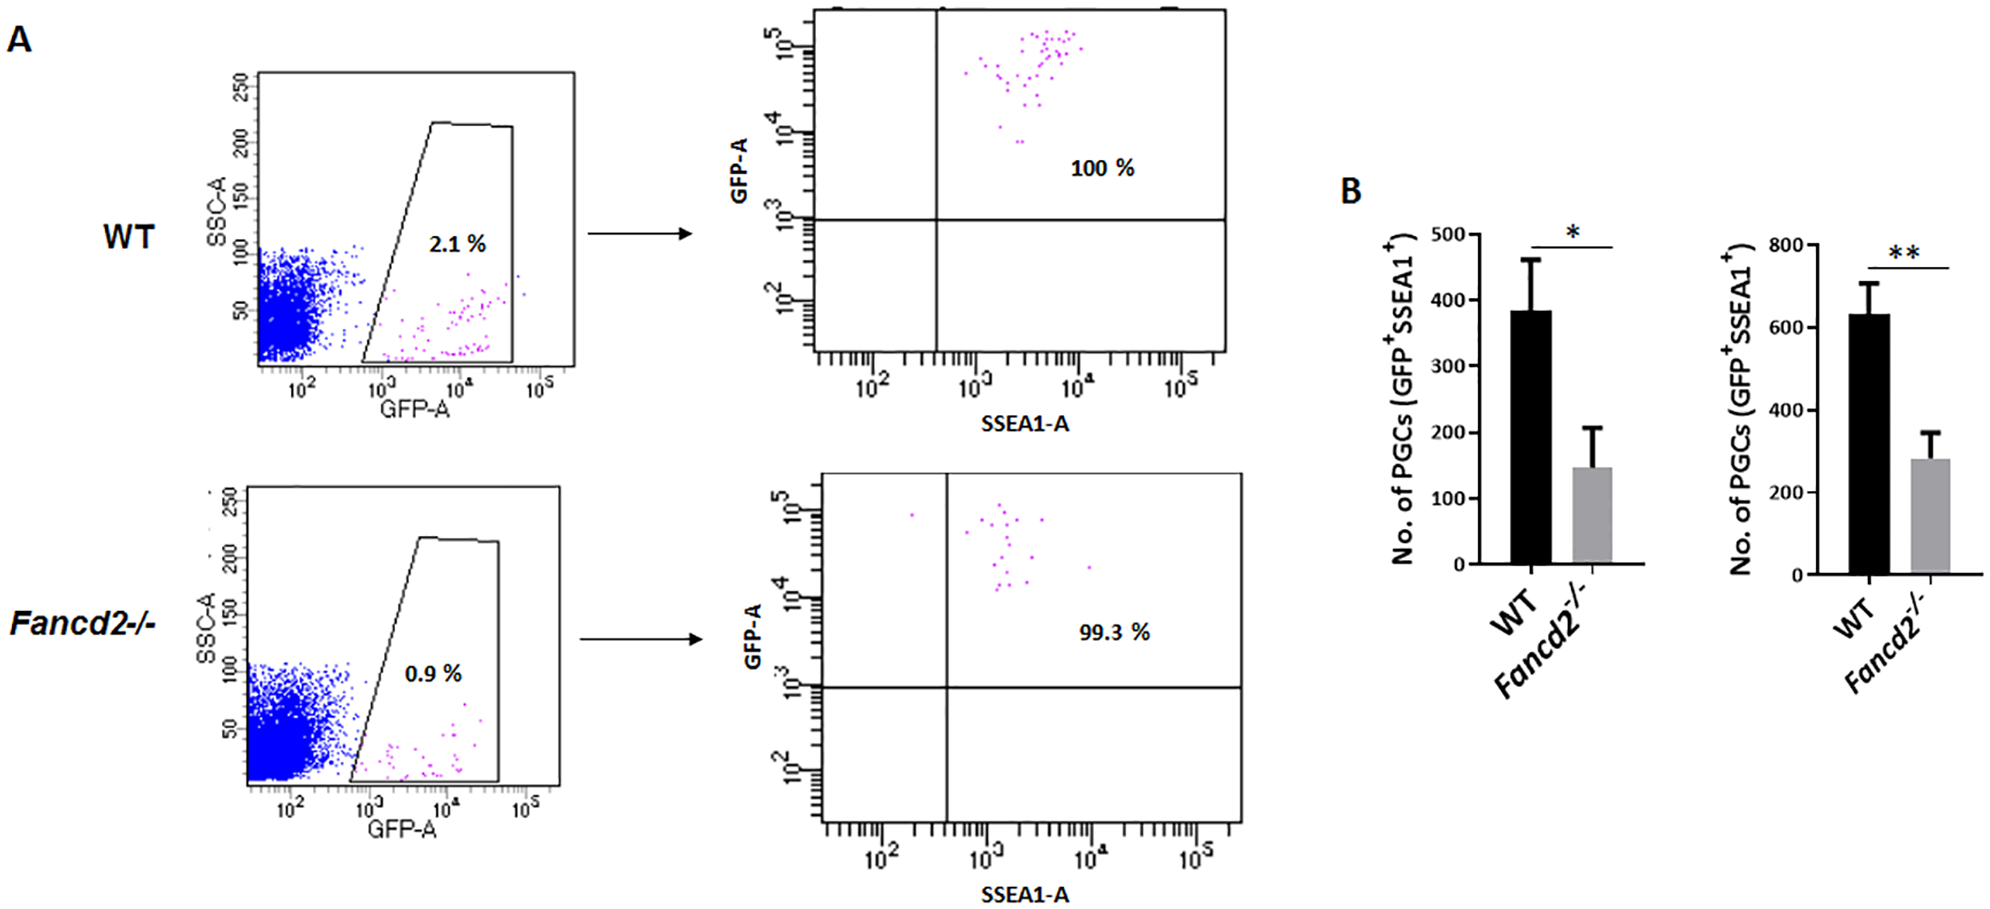
(A) Representative dot plots of flow cytometric analysis of GFP+ SSEA1+ PGCs from E11.5 embryos of WT and Fancd2−/− females expressing the Pou5f1-eGFP reporter gene. (B) The number of PGCs at E11.5 and E13.5 embryos of WT and Fancd2−/− females expressing the Pou5f1-eGFP reporter gene was determined by flow cytometry for GFP+ SSEA1+ PGCs. Results are presented as mean ± SD of three independent experiments. *p < 0.05, **p < 0.01