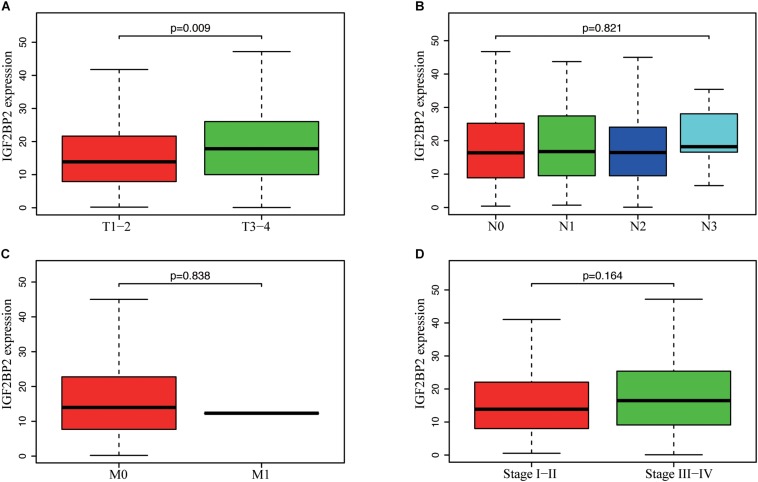
FIGURE 4.
Correlation between IGF2BP2 expression and clinicopathologic characteristics. (A) subgroup analysis of T classification (T1–2 and T3–T4). (B) Subgroup analysis of N classification (N0/N1/N2/N3). (C) Subgroup analysis of M classification (M0 and M1). (D) Subgroup analysis of clinical stage (stage I–II and stage III–IV). Wilcox test in A/C/D, Kruskal test in (B).

