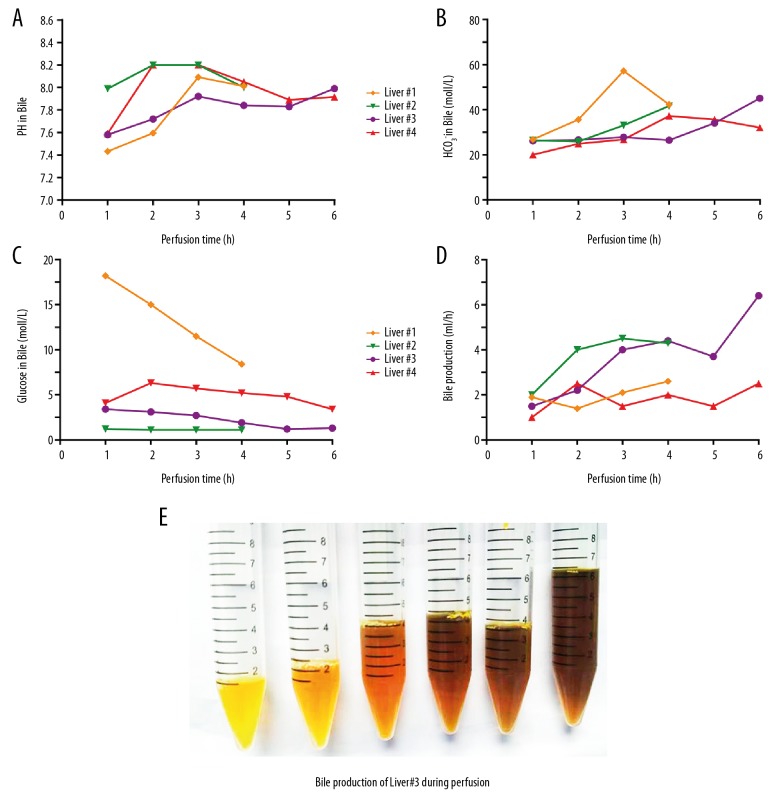
Figure 3.
Bile production and results of bile gas analysis during normothermic machine perfusion. (A–C) show pH values, HCO3−, and glucose levels in the bile every hour. (D) Bile production during perfusion. (E) Centrifuge tubes containing bile from liver 3. The bile production was increasing and the color of bile gradually turned darker.

