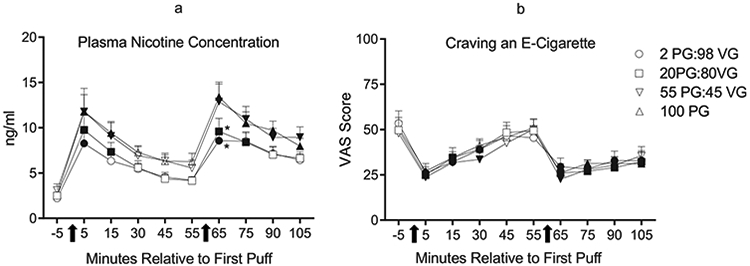
Fig. 1.

a: Mean plasma nicotine concentration (+SEM) from 30 ECIG-experienced participants during four independent sessions that differed only by PG:VG ratio. Arrows beneath the x-axis indicate the onset of each 10-puff ECIG use bout. Units on the x-axis represent the timepoints at which blood was sampled from participants relative to their first puff in bout 1. Filled symbols indicate a significant difference from baseline (−5 timepoint; Tukey’s HSD). Asterisks (*) indicate significant differences from the 100 PG:0VG condition at that timepoint (planned contrasts with Bonferroni correction: ps < .017). b: Mean ratings (+SEM) for the visual analog scale (VAS) item, “Craving an e-cigarette” from the Hughes-Hatsukami withdrawal scale. In all other respects the figure is identical to Fig. 1a.
