
Figure 3.
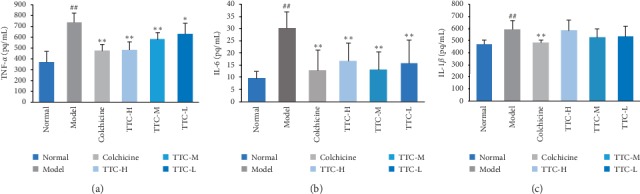
Effects of TTC on proinflammatory cytokines in MSU crystal-induced rats. The samples were ankle lavage fluid of rats. The evaluation time was 7 days after the administration of TTC. Data represent the mean ± standard deviation of values obtained from six animals. ##P < 0.01 compared with the normal control group; ∗P < 0.05 and ∗∗P < 0.01 compared with the hyperuricemic control group (ANOVA followed by Student's Newman–Keul's test).