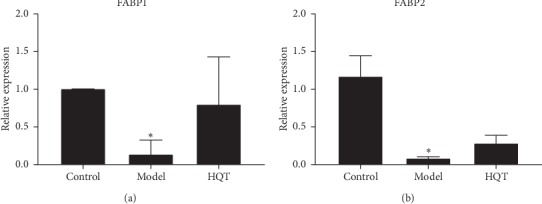
Figure 3.

Effect of HQT on mRNA expression levels of the corresponding genes (a) FABP1 and (b) FABP2 according to real-time PCR analysis. Data are represented as mean ± S.E. “∗”, “∗∗”and P < 0.05, P < 0.01, respectively, as compared with the normal control group. “#” and “##”, P < 0.05 and P < 0.01, respectively, as compared with the model group.
