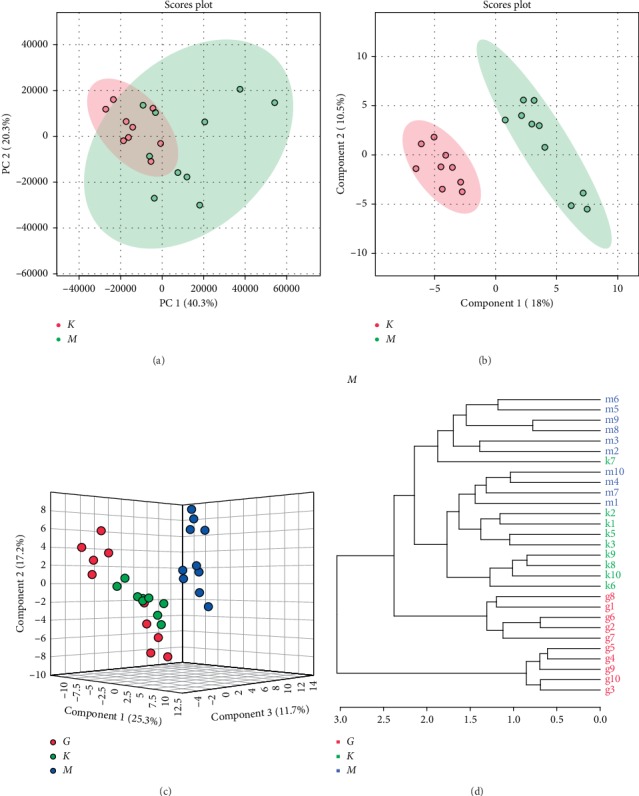
Figure 4.

Metabolomics analysis of urine samples from control, model, and HQT rats (K denotes the control group, M denotes the model group, and G denotes the HQT group). (a) PCA score plots for comprehensive metabolomic data of the model and control groups. (b) PLS-DA score plots for comprehensive metabolomic data of the model and control groups. (c) Score plots of the OPLS-DA of the model, control, and HQT groups. (d) Cluster analysis was performed on the model group, control group, and HQT group (distance measurement method: euclidean; clustering method: ward. D).
