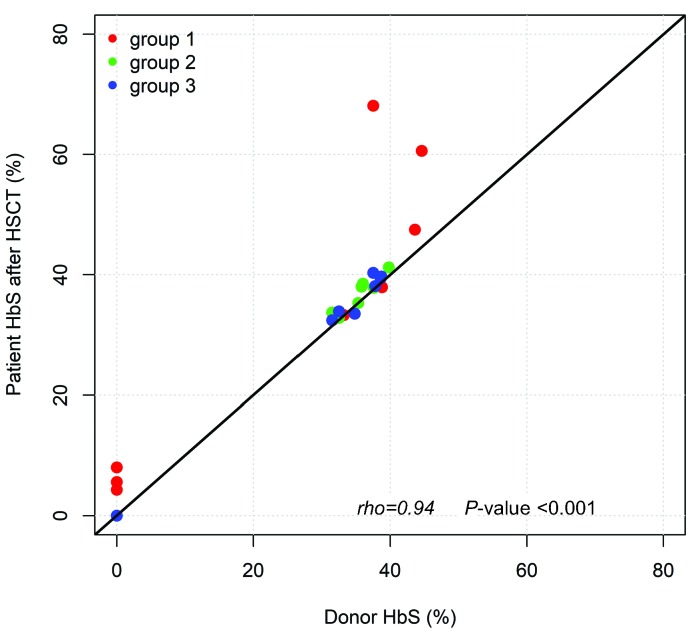
Figure 2.
Correlation between HbS in patients after hematopoietic stem cell transplantation (HSCT) and in donors, regardless of the donor’s genotype, divided into group 1 (mixed chimerism [MC] <70%, red dots), group 2 (MC 70-95%, green dots) and group 3 (MC 95-99.5%, blue dots). The line corresponds to y=x. Rho: Spearman’s rank correlation coefficient.

