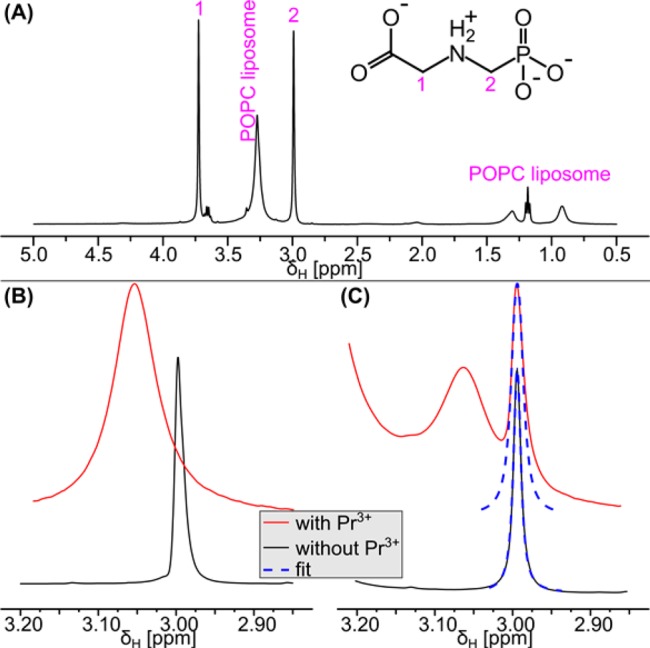
Figure 2.

Line broadening due to exchange can be quantified by fitting the peaks in 1H{31P} NMR spectra. (A) Clear separation of the glyphosate signals from the signals of the POPC liposomes in the 1H{31P} NMR spectrum (black line) enabling reliable peak shape analysis. (B) Spectral region showing glyphosate protons attached to carbon 2 with (red line) and without (black line) Pr3+ in the absence of liposomes. The line broadening upon Pr3+ addition was caused by the interaction with the paramagnetic Pr3+. Even though the signal without Pr3+ slightly overlapped with the broad glyphosate signal in the presence of Pr3+, both peaks were well resolved. (C) The glyphosate peaks inside and outside the liposomes remained well resolved when POPC liposomes were present. Fitting the peak shape (blue dashed lines) prior to (black line) and after (red line) the addition of PrCl3 yielded peak widths and, thus, allowed the line broadening to be quantified. The broadening of the glyphosate peak inside the liposomes (2.99 ppm) was caused by chemical exchange of glyphosate between the inside and the outside of the liposomes, because the nonpermeable Pr3+ was not able to interact with glyphosate inside the liposomes. All spectra in this figure were collected at pH 7.5.
