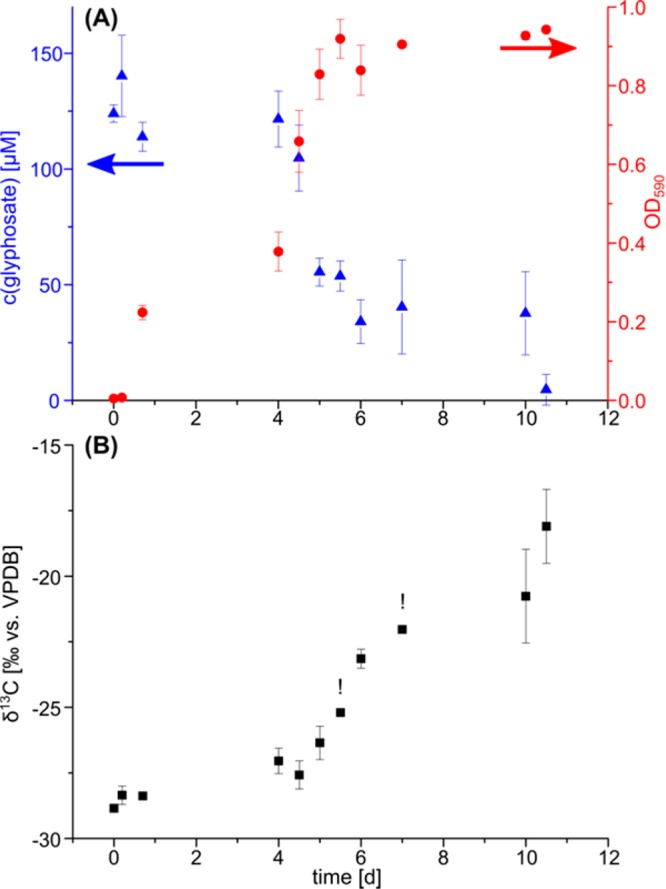
Figure 4.

Glyphosate biodegradation was accompanied by growth and strong isotope fractionation. (A) Glyphosate degradation by Ochrobactrum sp. FrEM. Consumption of glyphosate (blue triangles) as source of phosphorus led to bacterial growth (red circles). (B) During this biodegradation, 13C/12C ratios of glyphosate increased, as indicated by less negative δ13C values. All graphs show the mean and the error bars indicating the range of two biological replicates. The exclamation marks (!) above two isotope data points indicate that a reliable isotope value could be measured for only one biological replicate at the respective time points. Isotope values were measured in technical triplicates for each sample and are associated with an analytical uncertainty of ±0.3‰.
