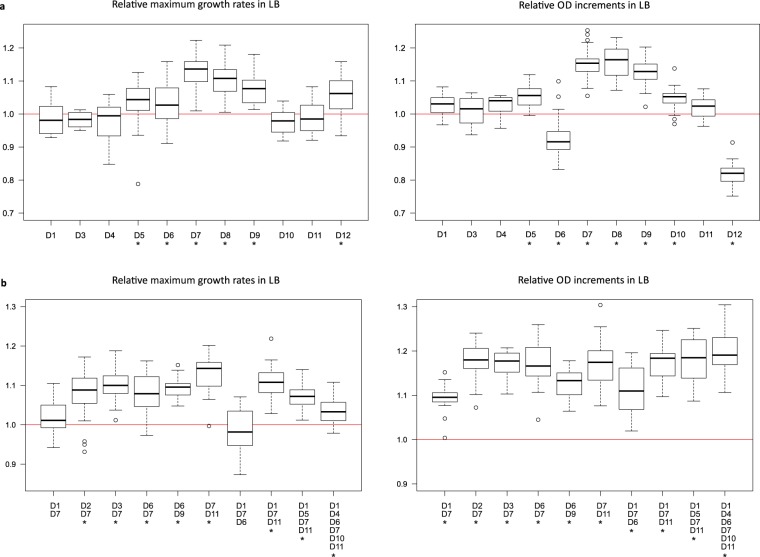
Figure 4.
Growth parameters of single- (a) or multiple-deletion (b) strains with reconstructed deletions. Strains are identified by the particular deletions (D1 to D12) they carry. Maximum growth rates and OD increments were compared to those of wild-type MG1655. Values are based on at least 18 replicate measurements in rich medium (LB). Centre lines show the medians, box limits indicate the 25th and 75th percentiles, whiskers extend 1.5 times the interquartile range, and outliers are represented by circles. Asterisks indicate significant difference in comparison to the wild-type (Welch’s t-test, P < 0.05).

