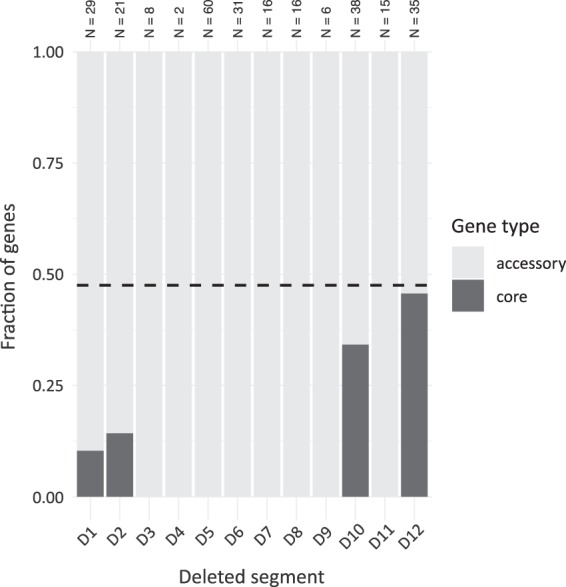
Figure 5.

Frequencies of core and accessory genes within the deleted segments. Identities of the particular deletions (D1 to D12) are given in Table 2. Dark bars represent the fraction of core genes compared to the total number of genes residing in the particular deleted region. The total number of genes that can be classified into core and accessory within each deleted region are shown on top of the bars. Dashed line represents the fraction of core genes in the entire genome.
