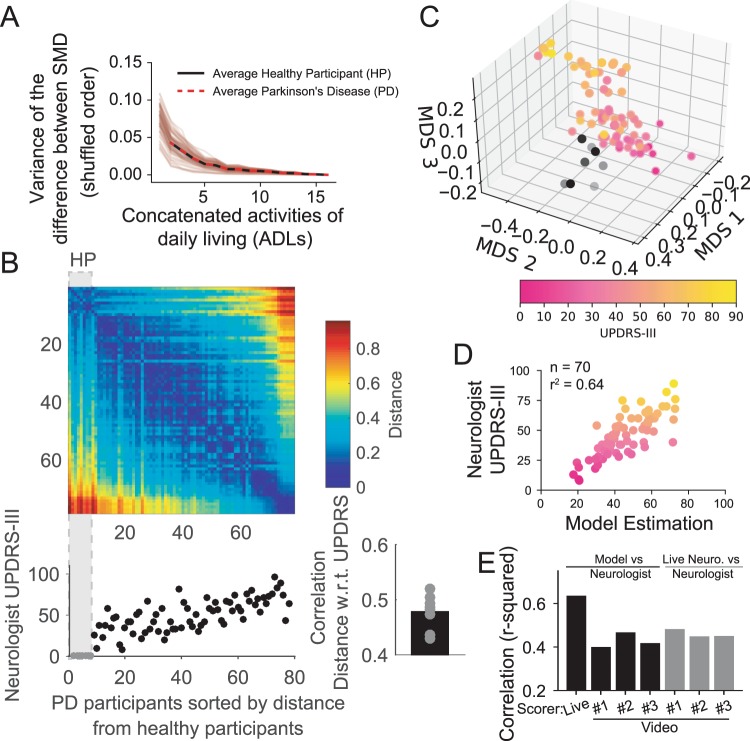
Figure 4.
Relationship of SMR and degree of motor impairment. (A) In red, Parkinson’s disease (PD) participants. In black, eldest healthy participants (HP). (B) On the top, a distance matrix showing the pairwise L1 distances between each SMR both for healthy (first 8 values - HP) and PD participants. Columns are sorted based on the distance from the averaged HP distribution. On the bottom, total UPRDS-III score of each PD participant sorted in the distance matrix (bottom left) and the correlation between of the L-1 distance of PD participants with respect to each HP and their UPDRS-III values. On average, sorting PD participants according to their distance from any HP produced an average correlation of 0.47. (C) MDS of the distances of B. The correspondent total UPRDS-III value for each participant is color coded. (D) Estimation of the UPDRS-III based on a linear model trained on the 3 components of the MDS. (E) Model estimation (black bars) measured as r-squared correlation when the MDS distances are regressed against neurologist examining the participant in person (Live) or through video clips i.e. Video Scorers. Also, the same models were built to predict the Live scorer based on the Video Scorers (gray bars).

