Fig. 7.
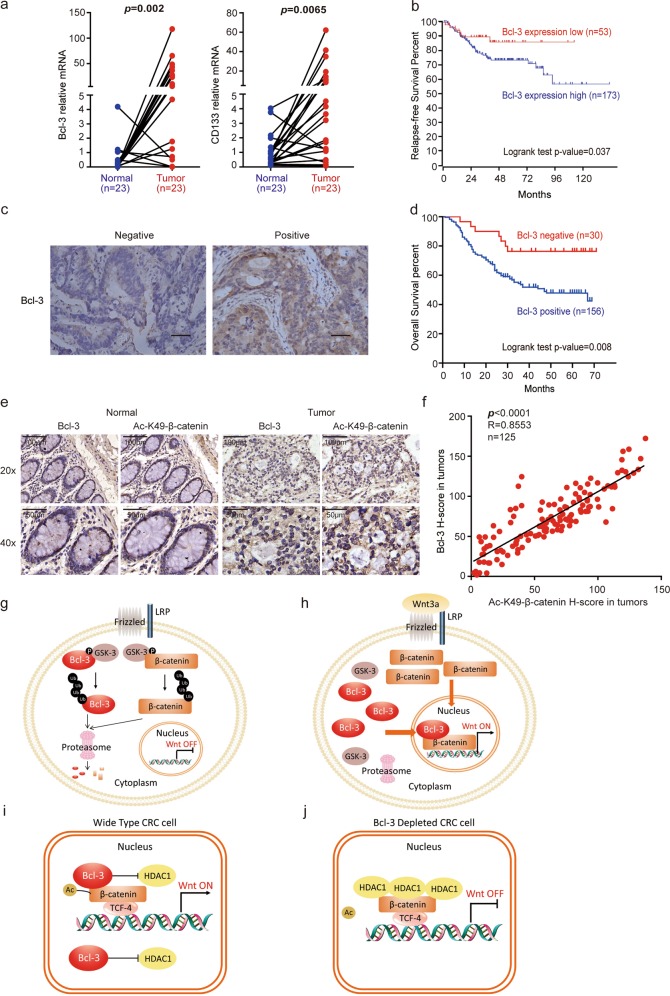
Bcl-3 is overexpressed in CRC tissues and correlates with CRC patient survival. a Bcl-3 and CD133 mRNA levels in 23 matched tumors and paired normal biopsies. p = 0.0009 for Bcl-3 and p = 0.0044 for CD133 by paired t-test. b Kaplan–Meier graph shows the survival analyses of patients with colorectal cancer based on Bcl-3 expression using R2: Genomics Analysis and Visualization Platform. c Representative images of positive and negative Bcl-3 staining in CRC patients. d Kaplan–Meier graph shows the overall survival rate in CRC patients based on Bcl-3 staining using IHC assay. e Representative images of Bcl-3 and Ac-K49-β-catenin expression based on IHC of serial sections of tissue microarrays. f The expression of Bcl-3 and Ac-K49-β-catenin in CRC tissue microarrays was analyzed by Spearman rank correlation coefficient analysis; R = 0.8646; p < 0.001; n = 125. g, h Cartoon illustration of the mechanisms by which Wnt3a increases Bcl-3 protein levels. i, j Cartoon illustration of the mechanisms by which Bcl-3 regulates the Wnt/β-catenin signaling pathway

