
Fig. 4. Cadmium isotope fractionation in cacao, cereals and Cd accumulators.
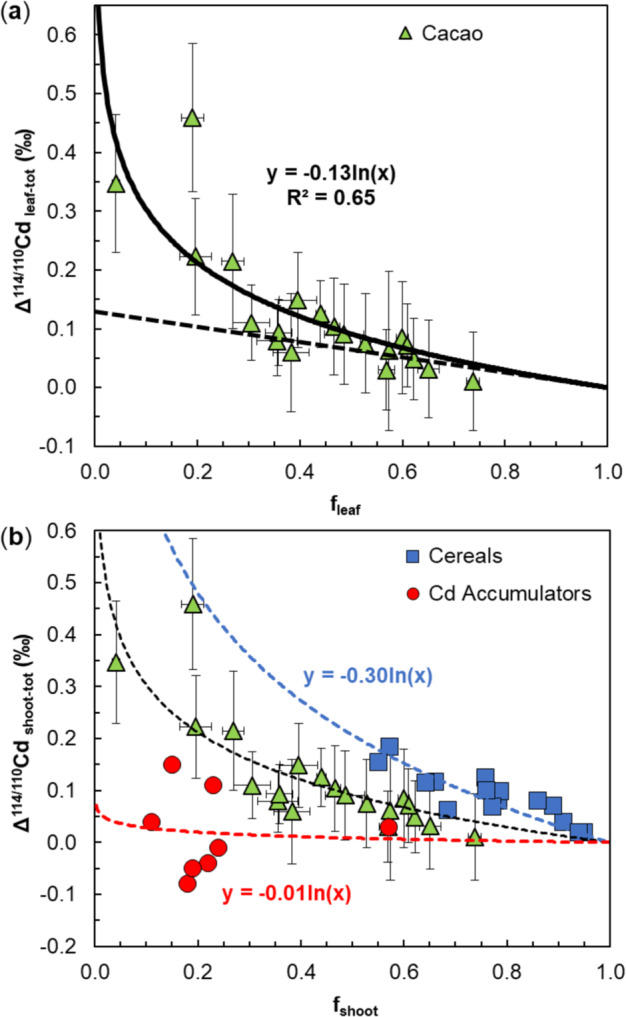
a Plot of Cd isotope fractionation Δ114/110Cdleaf-tot between cacao leaves and total plants versus mass fraction of Cd present in leaves. The solid line denotes a best-fit Rayleigh fractionation trend that is forced through Δ114/110Cdleaf-to: = 0 at fleaf = 1. This yields an isotope fractionation of Δ114/110Cdseq-mob = −0.13‰ between Cd sequestered in roots/stems and Cd mobilised to leaves. The dashed line denotes an open-system isotope fractionation trend with Δ114/110Cdseq-mob ≈ −0.13‰; this trend is in accord with some ‘outlier’ results, but provides a poor overall fit for the cacao data. b Plot of Cd isotope fractionation Δ114/110Cdshoot-tot between shoots and total plants versus the mass fraction of Cd present in shoots based on literature data for cereals (wheat, barley)33,34 and Cd accumulators35. The blue and red dashed lines denote best-fit Rayleigh fractionation trends for the two datasets, which are forced through Δ114/110Cdshoot-tot = 0 at fshoot = 1. The trends define Δ114/110Cdseq-mob fractionations of −0.30‰ for the cereals and −0.01‰ for the Cd accumulators