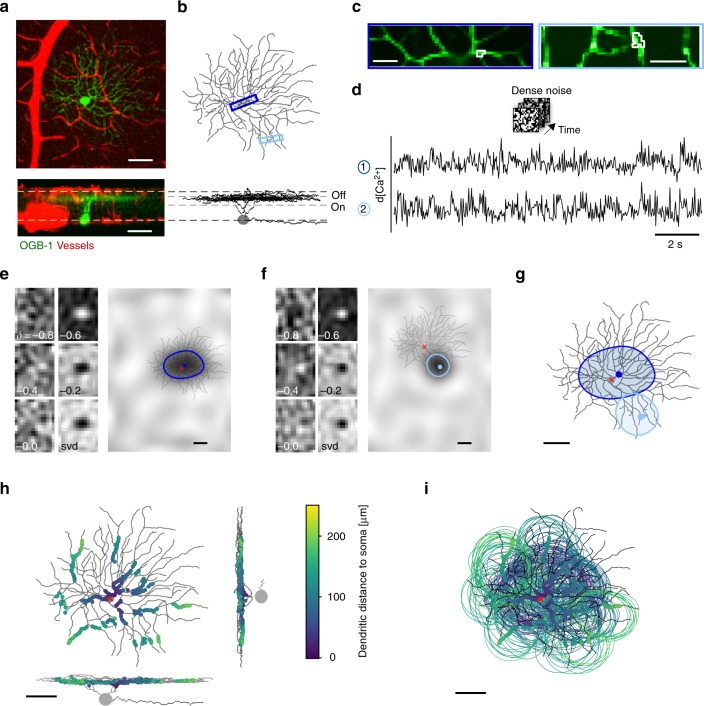
Fig. 1. Recording dendritic receptive fields (RFs) in individual retinal ganglion cells (RGCs).
a Z-projection of an image stack showing an Off-transient RGC filled with the synthetic Ca2+ indicator Oregon green BAPTA-1 (OGB-1; green) and blood vessels (red) in top view (top) and as side view (bottom). Dashed white lines mark blood vessels at the borders to ganglion cell layer (GCL) and inner nuclear layer (INL). b Reconstructed morphology of cell from a. Dashed grey lines between vessel plexi indicate ChAT bands. c Example scan fields, as indicated by blue rectangles in b, with exemplary region of interest (ROI; white) each. d De-trended Ca2+ signals from ROIs in c during dense noise stimulation (20 × 15 pixels, 30 µm per pixel, 5 Hz). e Smooth spatial receptive field (RF) maps from automatic smoothness detection (ASD) for left ROI in c at different times (δ, [s]) before an event and singular value decomposition (svd; Methods) map (left). Up-sampled RF map overlaid with the cell’s morphology (right; red crosshair indicates soma position), ROI position (blue dot) and RF contour. f Like e but for right ROI in c. g RF contours of ROIs from e, f overlaid on the reconstructed cell morphology. h Top- and side-view of example cell with all analysed ROIs (n = 15 scan fields, n = 193 of 232 ROIs passed the quality test; see Methods and Supplementary Fig. 1a, b), shown as dots and colour-coded by dendritic distance from soma. i RF contours of ROIs from h. Scale bars: a, b, e–i 50 µm, c 10 µm.

