
Fig. 2. Anatomical clustering of recorded RGCs.
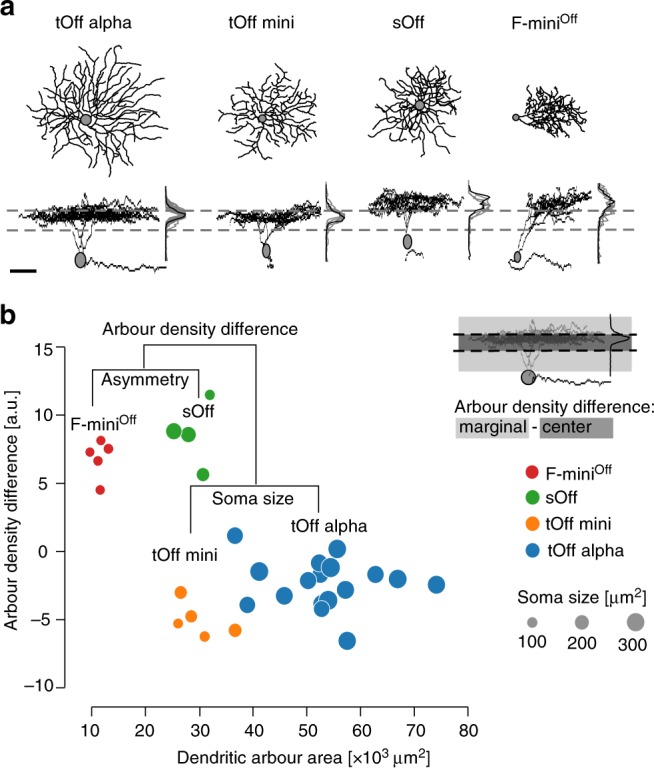
a, Top- and side-views of four reconstructed Off RGCs, one of each studied type, with IPL stratification profiles as mean (black) and for all recorded cells of that type (grey). Dashed lines indicate On and Off ChAT bands. b Cluster-dendrogram with the morphological parameters used in each clustering step and the resulting RGC groups: n = 17 tOff alpha, n = 5 tOff mini, n = 4 sOff, and n = 5 F-miniOff. Colours indicate cluster (RGC type), dot diameter represents soma area. Inset: Illustration of arbour density difference measure. Scale bar: a 50 µm.