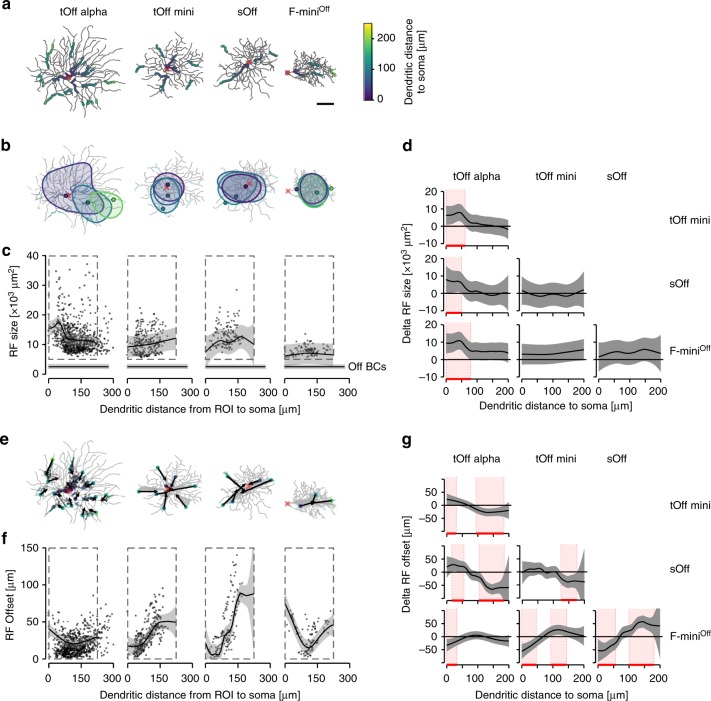
Fig. 3. Local dendritic RF area and position varies in different RGC types.
a Top-views of the different reconstructed RGC types, overlaid with ROIs that passed the RF quality test. ROI colours indicate dendritic distance to soma. b Cells from a with three ROIs of increasing distance from soma and corresponding RF contours overlaid (red cross indicates soma position). c Dendritic RF area as a function of dendritic distance to soma; data pooled across cells of the same type (see below). Horizontal black line marks mean RF size of Off BCs with s.d. shading in grey (2360 ± 1180 µm2, n = 4242 ROIs; data from (ref. 37)). d Comparison of RF area change with dendritic distance to soma for data marked by the dashed rectangles in c between each pair of RGC type. Red shaded areas indicate dendritic sections with significant differences between types (Methods). e Cells from a with arrows indicating spatial offset between ROI centre and the RF contour’s geometrical centre, with arrows pointing at the latter. f RF offset of all recorded ROIs as a function of dendritic distance to soma. g Like d but for RF offset changes for data points inside the dashed rectangles in f. Data from tOff alpha (n = 17\1452\850 cells\total ROIs\ROIs passing the quality test), tOff mini (n = 5\387\295), sOff (n = 4\208\154) and F-miniOff RGCs (n = 5\265\126); for individual cell morphologies, see Supplementary Fig. 4. Scale bar: a 50 µm. For details, see Supplementary Statistical Analysis.

