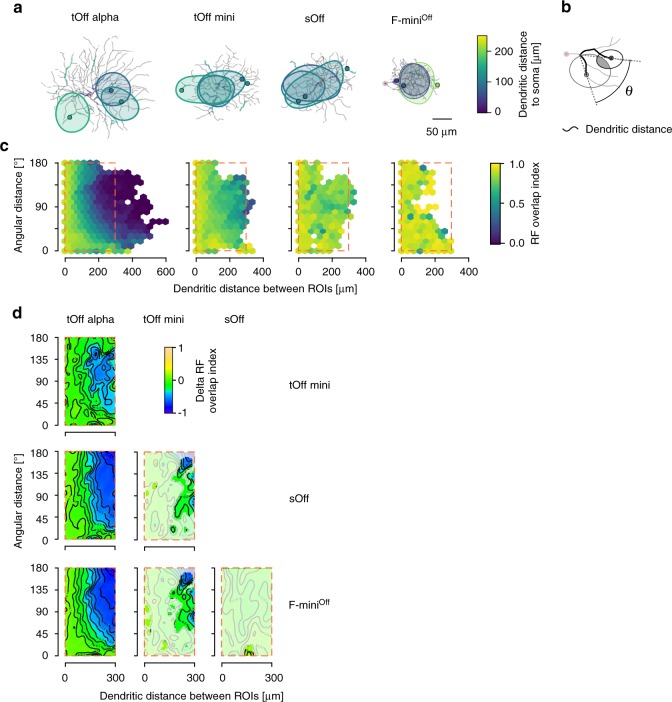
Fig. 4. Dendritic RF overlap.
a Top-views of the different reconstructed RGC types with RF contours of three ROIs overlaid. b, Illustration of dendritic and angular distance (Ѳ) between two ROIs (measured from the last common branching node) and RF overlap (grey area) of two RF contours (ellipses). c Hexagon maps showing the dendritic RF overlap index (colour-coded) as a function of Ѳ and dendritic distance for all ROI pairs: tOff alpha (n = 17\40,777 cells\ROI pairs), tOff mini (n = 5\13,524), sOff (n = 4\3141), and F-miniOff (n = 5\2097). d 2D comparison maps for plot area marked by the dashed red rectangles in c for each pair of RGC types. Colour codes difference in RF overlap index, with whitened areas indicating no significant difference. For details, see Supplementary Statistical Analysis.

