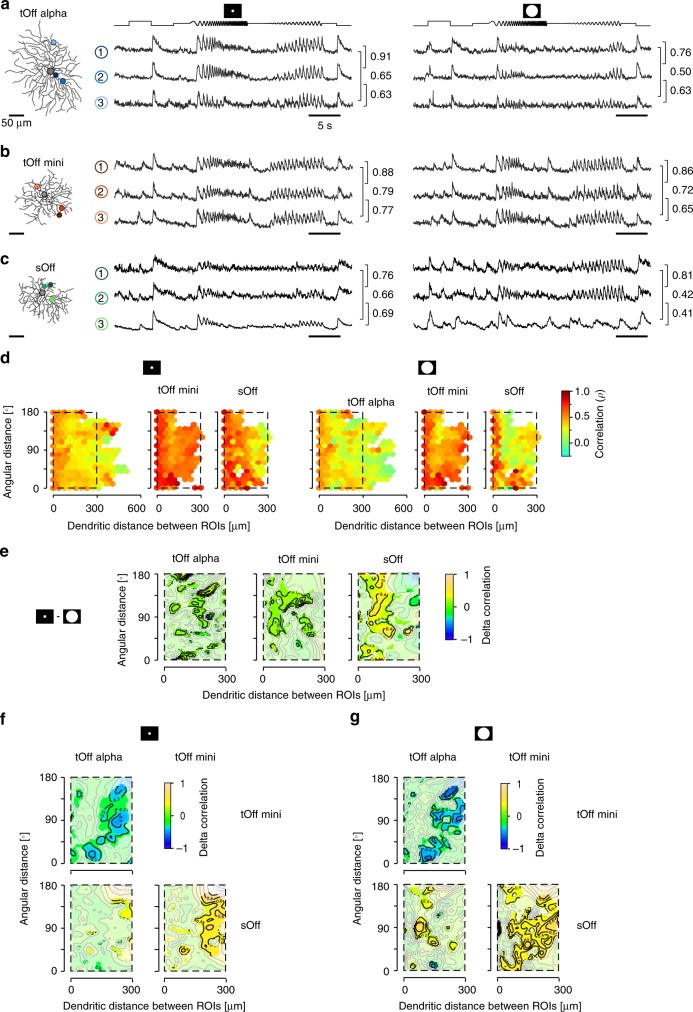
Fig. 5. Temporal correlation across dendrites.
a Exemplary response of a tOff alpha RGC to local (middle) and full-field chirp (right) recorded from three ROIs indicated on the reconstructed cell (left). Values next to the traces indicate linear correlation coefficient of the corresponding trace pair. b, c Like a, but for tOff mini (b) and sOff RGC (c). d Hexagon maps showing response correlations for local (left) and full-field chirp (right) as a function of angular distance and dendritic distance between ROIs for tOff alpha (n = 17\12,770\13,001 cells\pairs for full-field\pairs for local), tOff mini (n = 5\6529\6529), and sOff RGCs (n = 4\2622\2557). Colour encodes correlation. e 2D comparison maps for inter-ROI correlation of local and full-field chirp responses for the plot area marked by dashed black rectangle in d for each RGC type. Colour codes difference in correlation, with whitened areas indicating no significant difference. f, g Like e, but for the comparison between cell types for local chirp responses (f) and full-field chirp responses (g). For details, see Supplementary Statistical Analysis.

