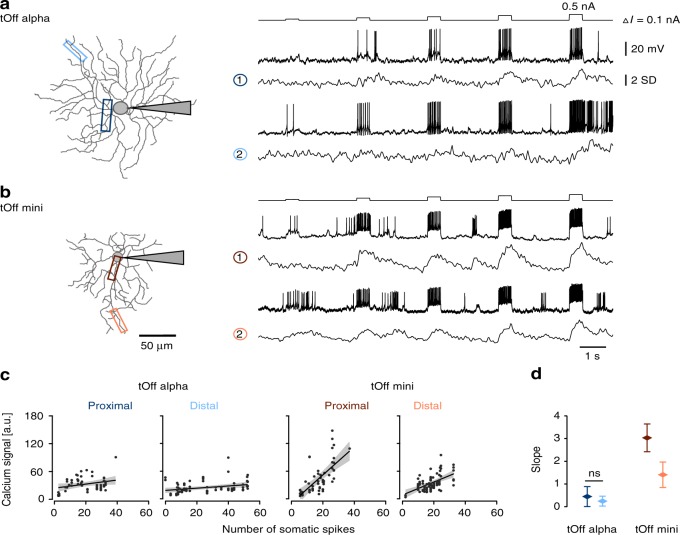
Fig. 6. Evaluating backpropagation using somatic current injections in tOff alpha and tOff mini cells.
a Left: tOff alpha cell recorded electrically at the soma using whole-cell patch-clamp (shaded triangle represents electrode) while imaging dendritic Ca2+ signals. Right: Simultaneously recorded somatic voltage and dendritic Ca2+ signals in response to somatic 500-ms current injections (0.1 to 0.5 nA, ∆I = 0.1 nA); Ca2+ signals from dendritic regions indicated by the boxes (left). b Same as in a, but for a tOff mini cell. c Dendritic Ca2+ signal (as area under the curve) as a function of spike numbers generated in the soma (tOff alpha, n = 3\55\80 cells\ROIs for proximal dendrite\ROIs for distal dendrite; tOff mini, n = 3\55\80; linear regression and corresponding confidence interval shown as black line and grey shading, respectively). d Slope from the linear regression in c for proximal and distal dendrites and both RGC types (same colours as in a–c). Data are presented as mean with error bars indicating 95% confidence intervals. Except for the slopes estimated based on for proximal and distal dendritic recordings in tOff alpha cells, all the slopes are significantly different across conditions (F(3, 267) = 27.357, p < 0.0001. Tukey’s method is used for post hoc pairwise comparison. For details, see text and Supplementary Statistical Analysis).

