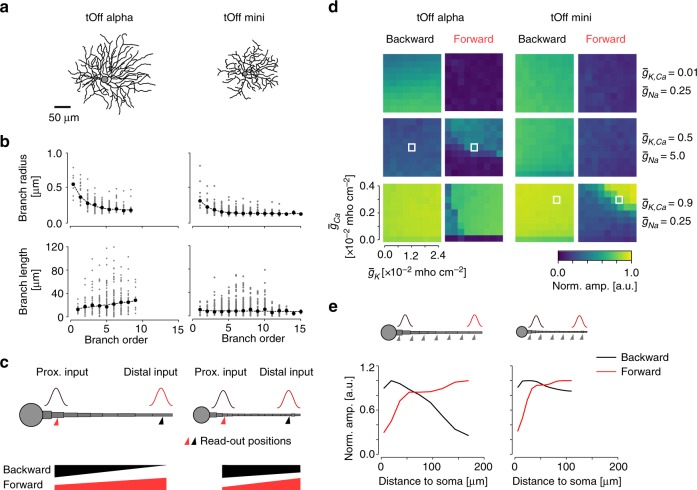
Fig. 7. Simulation of dendritic signal propagation in tOff alpha and tOff mini RGCs.
a Reconstructed cell morphologies of tOff alpha and tOff mini RGC (same cells as in Figs. 3, 4). b Dendrite radius (top) and segment length as functions of branch order (data from http://museum.eyewire.org; n = 2 for tOff alpha (4ow); n = 3 for tOff mini (4i)). c Illustration of the ball-and-stick models used for simulations in d, e. Simulated inputs at proximal (25 µm to soma) and distal (85% of the total dendrite length to soma) positions indicated as red and black Gaussians, respectively. Respective read-out positions for d are indicated below the dendrite. The thickness change of the bars (bottom) corresponds to the decay of forward (red) and backward (black) signal propagation expected from our experimental data. d Heat maps showing the signal amplitude at the two read-out positions indicated in c, normalised to the amplitude at the respective input position as a function of ion channel density combinations. White boxes indicate channel combinations that are consistent with our experimental results. e Normalised signal amplitude at read-out positions along the dendrite as a function of dendritic distance for the channel combinations indicated by boxes in d. Generic voltage-gated (, , ) and Ca2+ activated () conductances were modelled after Fohlmeister and Miller (refs. 67). For details, see Methods.

