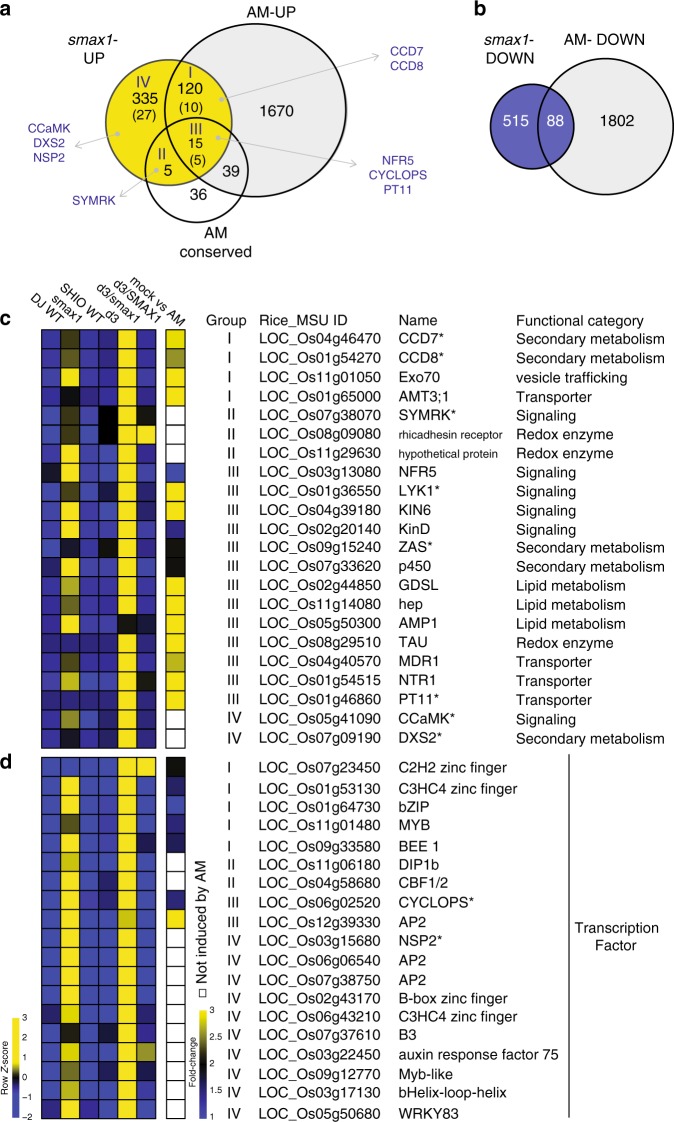
Fig. 4. SMAX1 regulates AM-associated genes.
a The Venn diagram shows commonly upregulated genes in smax1 and during AM symbiosis51, or overlapping with genes conserved in AM-host plant species52. smax1-UP represents the genes upregulated either in smax1 or d3/smax1. The number in parenthesis indicates the number of genes that are not expressed in wild-type but induced in either smax1 or d3/smax1. Genes with known function in AM symbiosis are shown in capital letters. b The Venn diagram displays commonly suppressed genes in smax1-DOWN and during AM symbiosis51. c, d The heatmap depicts relative expression levels and fold-change of induction during AM symbiosis of key genes involved in AM symbiosis, and of AM conserved genes (c) and transcription factors (d) that were induced in either smax1 or d3/smax1. Asterisk indicates genes whose functions are previously characterized (See Supplementary Table 2).

