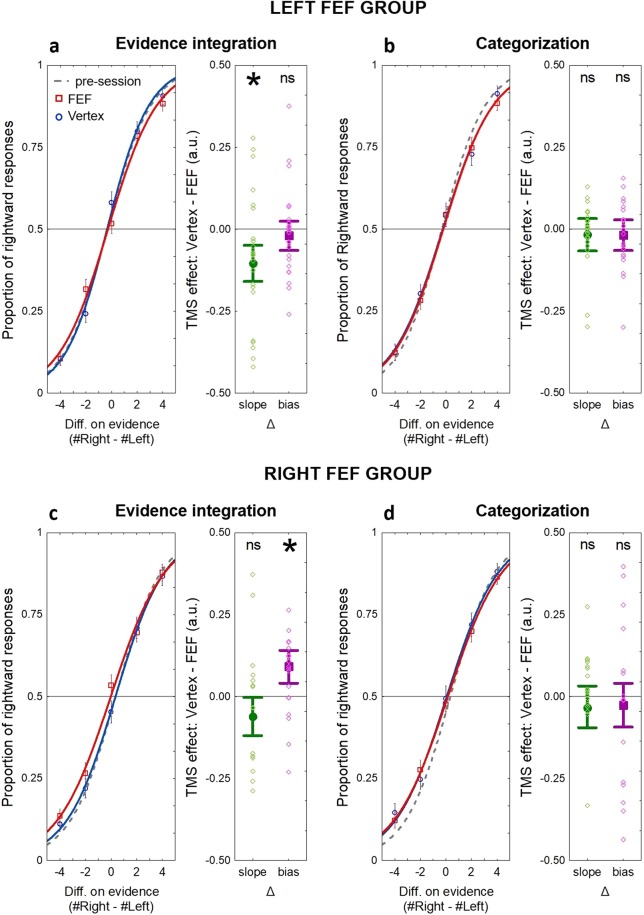
Figure 2.
The proportion of rightward choices as a function of the signed difference in evidence (tactile pulses) across the stimulation group. (a) TMS effect on choices during evidence integration period (T1) in the left FEF group. Left FEF stimulation resulted in decreased sensitivity to evidence, reflected by the significant difference between active (FEF-stimulation) and control (vertex-stimulation) conditions (∆ slope). (b) TMS effect on choices during categorization period (T2) in left FEF group. There was no significant change in choice behaviour following FEF vs vertex stimulation during categorization period. (c) TMS effect on choices during evidence integration period (T1) in the right FEF group. Right FEF stimulation resulted in response bias towards rightward choices, reflected by a significant ∆ bias. (d) TMS effect on choices during categorization period (T2) in right FEF group. There was no significant change in response behaviour following FEF vs vertex stimulation during categorization period. The dashed lines mark the performance in pre-session inside the MR scanner to illustrate the non-neural effects of TMS29 [see the Experimental design and statistical analyses section]. On the left-side figures (main plots), the dots present the data, while lines are logistic curves. The right-side figures represent the estimation of difference between the slope and bias of the two curves in the respective main plot (a, b, c or d), while dots represent individual data. Vertical bars on all plots denote +/− standard error of the mean.

